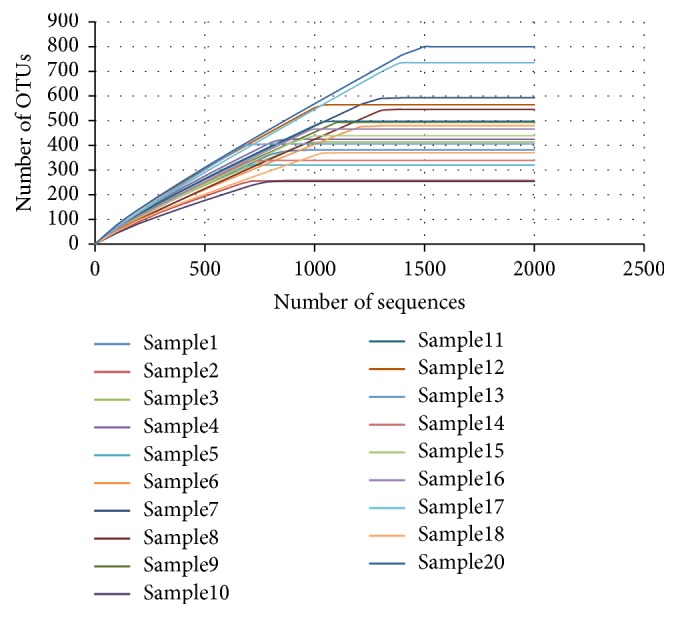
Figure 6.

Rarefaction curves of 16S rRNA gene sequences for each sample calculated for OTUs at 97% similarity. Vertical axis shows operational taxonomic units, and horizontal axis shows the number of samples sequenced. OTUs = operational taxonomic units.
