Figure 7.

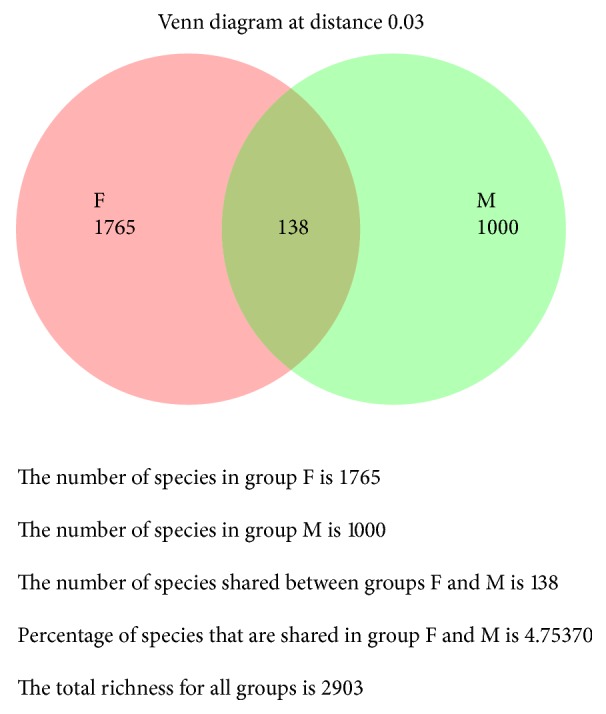
Venn diagram illustrated the number of shared OTUs between males and females at 97% similarity. Colored circles represented each sex and intersection part between circles represented the number of shared OTUs.

Venn diagram illustrated the number of shared OTUs between males and females at 97% similarity. Colored circles represented each sex and intersection part between circles represented the number of shared OTUs.