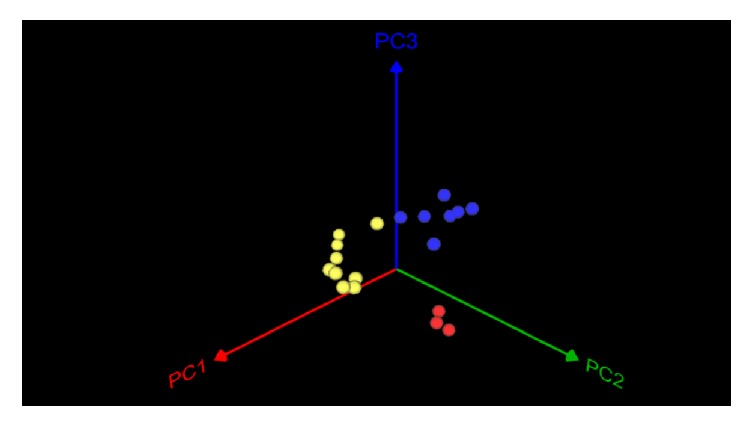
Figure 9.

A three-dimensional plot of weighted UniFrac based principal coordinate analysis (PCoA). Colors represented the three groups based on 16S rRNA dendrogram. Yellow, blue, and red balls resembled Groups A, B, and C respectively. Plot was created using the pairwise weighted UniFrac distances (where PC1 is variability at 25.57%, PC2 is variability at 14.69%, and PC3 is variability at 11.44%). Samples from the same group cluster more closely together.
