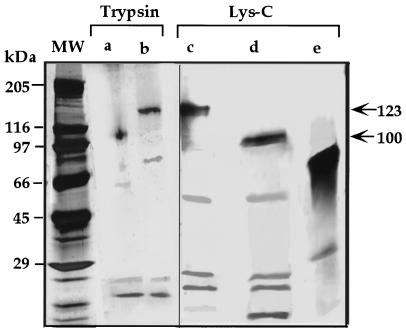
Figure 3.
Limited proteolysis analysis of the 100- and 123-kD polypeptides. The 100- (a and d) and 123-kD (b and c) bands were excised from a SDS gel, treated with trypsin (a and b) or Lys-C (c and d), and separated on a second-dimensional SDS gel. The second-dimensional gel was silver stained. The non-related 60-kD Glu dehydrogenase band, co-fractionated with the LKR/SDH bands, was also digested with Lys-C as a control (e). Sizes of protein markers are indicated on the left and the positions of the intact 100- and 123-kD polypeptides are indicated by arrows on the right.

