Abstract
Long exposure to the microgravity will lead to muscle atrophy and bone loss. Treadmill exercise could mitigate the musculoskeletal decline. But muscle atrophy remains inevitable. The constraint loading applied on astronauts could affect the muscle force and its atrophy severity. However, the quantitative correlation between constraint loading mode and muscle forces remains unclear. This study aimed to characterize the influence of constraint loading mode on the lower limb muscle forces in weightless treadmill exercise. The muscle forces in the full gait cycle were calculated with the inverse dynamic model of human musculoskeletal system. The calculated muscle forces at gravity were validated with the EMG data. Muscle forces increased at weightlessness compared with those at the earth's gravity. The increasing percentage from high to low is as follows: biceps femoris, gastrocnemius, soleus, vastus, and rectus femoris, which was in agreement with the muscle atrophy observed in astronauts. The constraint loading mode had an impact on the muscle forces in treadmill exercise and thus could be manipulated to enhance the effect of the muscle training in spaceflight. The findings could provide biomechanical basis for the optimization of treadmill constraint system and training program and improve the countermeasure efficiency in spaceflight.
1. Introduction
Long exposure to the microgravity will lead to the decline of musculoskeletal system, including muscle atrophy and bone loss [1]. The decrement of muscle volume and performance significantly occurs in the lower limbs [2, 3]. Previous studies have reported an 8.8% to 15.9% reduction of plantar flexor muscle volume [4], a 35%–40% reduction of neuromuscular activity, and a 17% reduction of maximal isometric torque after spaceflight [5]. The decrease of muscle force will subsequently aggravate bone loss in microgravity [6, 7]. Long duration of spaceflight will further lead to musculoskeletal injuries including bone fracture, muscle tears, and back pain [2, 8–10]. Molecular and cellular studies revealed that mechanical environment is a critical factor to maintain the musculoskeletal function [11–13]. Therefore, a properly designed loading stimulation, such as exercise, could help counteract the negative effect of microgravity.
Treadmill exercise could mitigate the musculoskeletal weakening to some extent. Currently, the used exercise devices in the International Space Station (ISS) include treadmill, bicycle ergometer, and resistance exercise device. Among these countermeasures, a significant correlation between treadmill training intensity and the muscle mass maintenance was observed, and muscle losses of astronauts with high-volume treadmill exercise were about 59% less than those with low-volume treadmill exercise [3, 14]. During the training, astronauts have to be restrained with bungee cords, which provide the vertical loading instead of the gravity effect. Increasing the constraint force may mitigate the musculoskeletal decline but can cause discomfort and local injury at the harness contact regions [15]. Constraint force of 70% to 80% body weight was usually applied according to individual experience, which may limit the efficiency of the treadmill countermeasure [3, 15]. An optimal constraint system is desired to reduce the risk of local discomfort and increase the mechanical stimulation on the musculoskeletal system. However, the quantitative relationship between treadmill constraint system and in situ force in bones and muscles remains unclear.
Numeric musculoskeletal model combined with motion capture equipment could be used to estimate the in situ load on the bone and muscle during treadmill exercise. The muscle force and joint kinetics could be calculated from kinematical data with the inverse dynamic analysis. Then, the stress of the bone under muscle forces could be calculated with the finite element simulation [16, 17]. The methodology has been applied in sport, rehabilitation, and exoskeleton design [18–21]. Quantification of musculoskeletal loading in treadmill exercise could provide biomechanical basis for the optimization of training system and improve the countermeasure efficiency.
This study aims to investigate the influence of the constraint loading mode on the lower limb muscle force in treadmill training at weightlessness. An inverse dynamic musculoskeletal model was applied to simulate the treadmill exercise. Five loading modes of the constraint system were analyzed. Due to the lack of kinematical data at weightlessness, the kinematical data of treadmill exercise at gravity was used. To minimize the result deviation caused by this simplification, the sum of the constraint loadings was assumed to be equal to the body weight.
2. Materials and Methods
2.1. Participants
Eight healthy and physically active participants volunteered to take part into the study (5 males and 3 females, age 20 ± 2, height 1.74 ± 0.16 m, and weight 63.5 ± 20 kg). Volunteers were recruited among university students. The study was approved by the local ethics board and every subject signed an informed consent before performing the trials.
2.2. Motion Capture Experiment
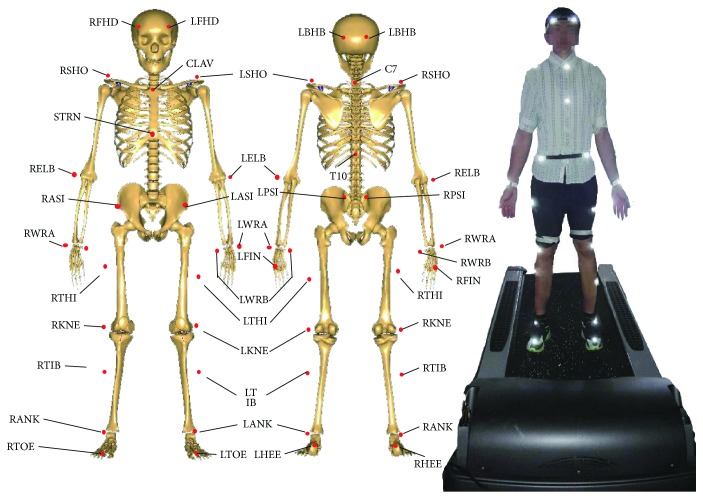
The subjects' kinematical information was recorded with the motion capture system, Vicon (Vicon, Oxford Metrics Ltd., UK). 34 reflective markers were attached to the bony landmarks of the subject (Figure 1). The markers' spatial coordinates were captured by 8 cameras with the sampling frequency of 100 Hz. Cameras were fixed on the wall to avoid vibration interference. Subjects were required to run on the treadmill with the speed of 1.5 m/s, which was a routine speed in the astronaut training program [10]. After the subject adapted to the treadmill speed (30 seconds), the motion information was recorded for 30 seconds. 10 stable full gait cycles were extracted from each measurement for muscle analysis. In the present study, one gait cycle was defined as the period between two adjacent left foot landings. Each subject was measured for 3 times, with one-minute interval. To eliminate the influence of the shoes on the gait, subjects were required to wear the same type of shoes with proper sizes.
Figure 1.
The locations of markers for motion capture experiment. Totally, 34 markers were fixed on the body during the treadmill exercise. The following is the meanings of the abbreviation for the markers' anatomic locations. R(L)FHD: right (left) front head; R(L)BHD: right (left) back head; R(L)SHO: right (left) shoulder; C7: 7th cervical; T10: 10th thoracic; CLAV: clavicle; STRN: sternum; R(L)ASI: right (left) anterior superior iliac; R(L)PSI: right (left) posterior superior iliac; R(L)ELB: right left elbow; R(L)WRA(B): right (left) wrist A(B); R(L)FIN: right (left) finger; R(L)THI: right (left) thigh; R(L)KNE: right (left) knee; R(L)TIB: right (left) tibia; R(L)ANK: right (left) ankle; R(L)TOE: right (left) toe; R(L)HEE: right (left) heel.
2.3. Inverse Dynamic Model of Human Musculoskeletal System
A human musculoskeletal model was developed with the inverse dynamic software, AnyBody Managed Model Repository (AnyBody Technology, Denmark). The lower limbs of the model contain 6 joints and 318 muscles. The accuracy of the muscle force prediction model was validated in the previous study. Compared with the in vivo-measured maximal voluntary moment, the calculated data was within the 95% confidence interval [22]. The weight, height, thigh length, shank length, foot length, and pelvis width of the model were set according to the subject. The model was driven by the motion information of the markers from motion capture experiment (Figure 2(a)). The ground reaction force (GRF) during running was calculated with a GRF prediction module [23, 24].
Figure 2.
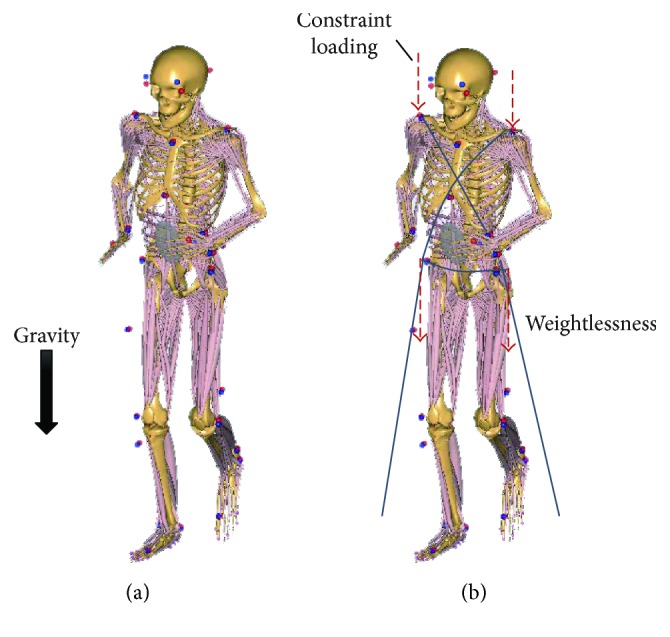
Inverse dynamic model of human musculoskeletal system and the diagram of loading conditions. The lower limbs of the model contain 6 joints and 318 muscles. (a) The model was in the condition of normal gravity. (b) The model was in the condition of weightlessness; the body was restrained with the bungee cords, which provide the vertical loading instead of the gravity effect.
2.4. Constraint Methods
In the weightless condition, bungee cords were applied instead of gravity to constrain the body on the treadmill during exercise. Previous studies have suggested that providing a constraint force equal to gravity could better prevent musculoskeletal decline in spaceflight [14, 25]. Therefore, in the present study, the resultant force of the bungee cords was assumed to be constantly equal to gravity. The constraint forces of eight loading modes were applied on the shoulder (bilateral acromion) and waist (bilateral anterior superior spine) (Figure 2(b)). The influence of the constraint loading modes on lower limb muscle forces was analyzed. Eight loading modes of constraint system were analyzed (Table 1).
Table 1.
The constraint loading applied on the shoulder and waist.
| Mode 1 | Mode 2 | Mode 3 | Mode 4 | Mode 5 | |
|---|---|---|---|---|---|
| Shoulder loading | 1 BW | 2/3 BW | 1/2 BW | 1/3 BW | 0 BW |
| Waist loading | 0 BW | 1/3 BW | 1/2 BW | 2/3 BW | 1 BW |
BW: body weight.
In the weightless musculoskeletal model, the gravity was set to zero. The experiment on NASA KC-135 research aircraft had reported that the gait at weightlessness approached to the gait at gravity when the resultant constraint force increased to body weight on earth [26]. Therefore, the kinematical data of treadmill exercise at gravity was also used to drive the musculoskeletal model at weightlessness. A quadratic muscle recruitment method was implemented in the present study.
2.5. Muscle Force and Data Processing
The following muscles were analyzed in the present study: biceps femoris, gastrocnemius, vastus, soleus, and rectus femoris, which were primary active muscles in treadmill exercise. The muscle forces in the full gait cycle were calculated. To normalize the data for each trail, the muscle force was divided by the subject's body weight. Then, the normalized muscle forces of all subjects' trails were averaged. A Two-way random average measure intraclass correlation coefficient (ICC (2, k)) was used to assess the reliability of the motion capture and muscle force calculation. Values greater than 0.75 indicate desirable repeatability of the methodology. Statistical software SPSS (IMB, US) was used for the data analysis.
2.6. Comparison with Electromyography (EMG)
To evaluate the reliability of the muscle force calculation, the calculated muscle forces in treadmill exercise at gravity were compared with the muscle EMG data in the literature [27]. The magnitude of the EMG could not sensitively reflect the muscle force in different muscles and action types; therefore, the correlation between the timing of peak EMG and the timing of peak muscle force in the full gait cycle was calculated to evaluate the validity of the muscle force calculation with the statistical software SPSS (IMB, US). The Spearman correlation factor was calculated. A correlation coefficient different from 0 and a significant level (p value) < 0.05 indicates a considerable correlation.
3. Result
3.1. Relationship between Muscle Force and EMG
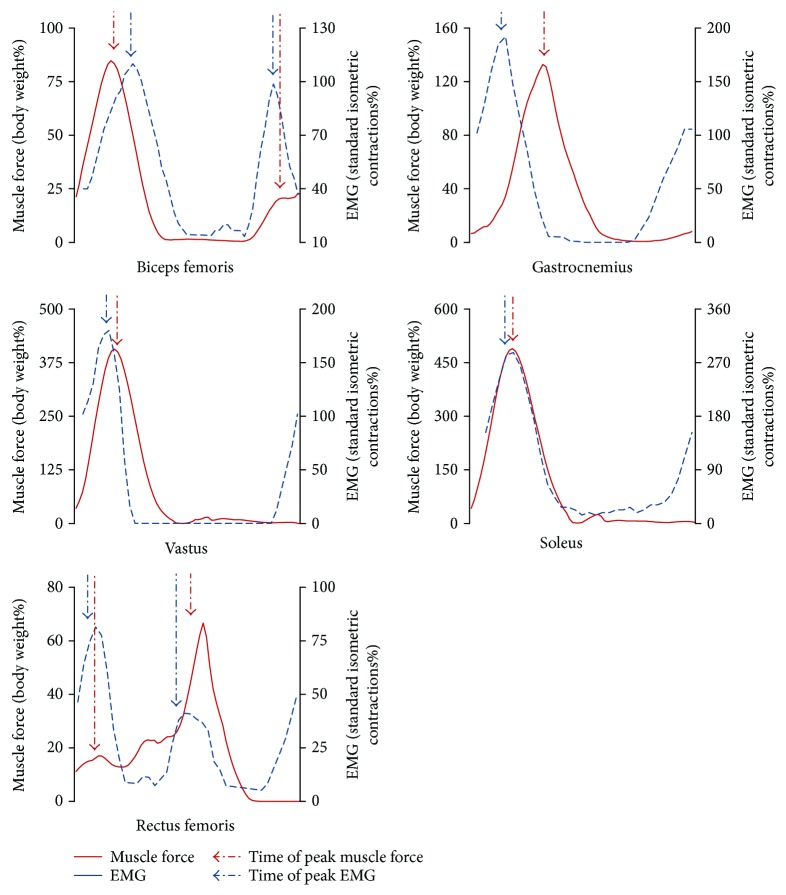
The normalized force and EMG of the biceps femoris, gastrocnemius, vastus, soleus, and rectus femoris in the full gait cycle were shown in Figure 3. The timing of the peak muscle force was positively correlated with the timing of the peak EMG (r = 0.757∗, p = 0.049), which provided the validity of the muscle force calculation (Table 2). Furthermore, the ICC (2, k) results of the muscle forces in gravity and each loading mode were greater than 0.75, which indicate desirable repeatability of the methodology (Supplementary Material, Tables S1 and S2).
Figure 3.
The force and EMG of the biceps femoris, gastrocnemius, rectus femoris, soleus, and vastus in a full gait cycle. The muscle forces were normalized with body weight; the EMG magnitudes were normalized with the standard isometric contractions. Since EMG magnitude could not sensitively reflect the muscle force, the correlation between the timing of peak EMG and the timing of peak muscle force was calculated to evaluate the validity of the muscle force calculation.
Table 2.
The timings of the peak muscle forces and the peak EMGs in the full gait cycle.
| Biceps femoris (1st peak) | Biceps femoris (2nd peak) | Gastrocnemius | Rectus femoris (1st peak) | Rectus femoris (2nd peak) | Soleus | Vastus | |
|---|---|---|---|---|---|---|---|
| Force | 15% | 90% | 32% | 10% | 55% | 18% | 17% |
| EMG | 17% | 86% | 12% | 7% | 49% | 10% | 7% |
3.2. Influence of Loading Mode on Muscle Force
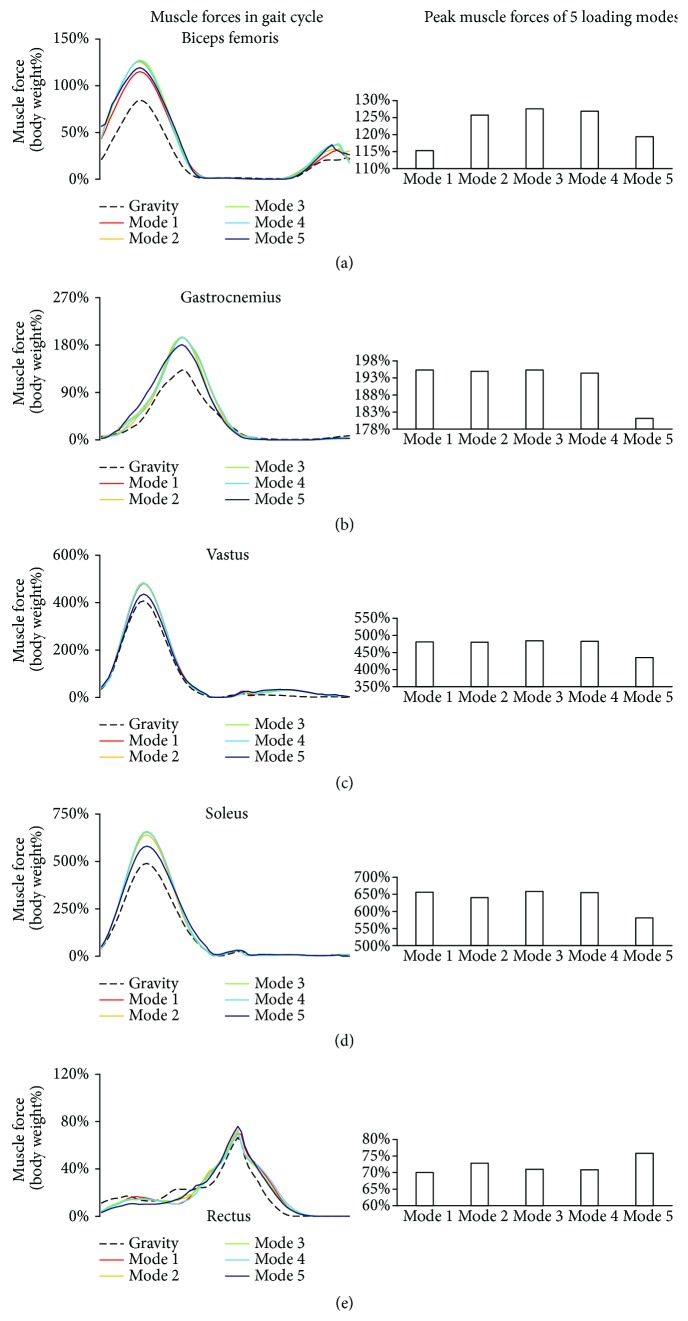
Although the resultant constraint loading was constantly equal to the body weight at gravity, the maximum forces of biceps femoris, gastrocnemius, and vastus at weightlessness (all five modes) were greater than those at gravity (paired-samples t-test, p < 0.01). Furthermore, the muscle forces changed with the constraint modes. The average and the deviation of all normalized muscle forces were contained in Supplementary Material (Figures S1–S5, Tables S3–S7).
The biceps femoris was activated in both stance and swing phases; a larger peak muscle force occurred in the stance phase, and a smaller peak muscle force occurred in the swing phase (Figure 4(a)). With the constraint loading migrating from shoulder to waist, the maximum muscle force firstly increased and then decreased, ranging from 115% to 128% of body weight.
Figure 4.
Muscle forces at gravity and five loading modes at weightlessness. The muscle forces were normalized with the body weight. For each muscle, the curve of the forces in the full gait cycle under 6 loading conditions was compared. Muscle forces at weightless condition were greater than those at gravity. (a) Biceps femoris; (b) gastrocnemius; (c) vastus; (d) soleus; (e) rectus femoris.
Gastrocnemius was activated at the end of the stance phase and the beginning of the swing phase, which was a result of flexion of the knee when lifting the leg. Only one peak was observed in the gastrocnemius force curve (Figure 4(b)). With the constraint loading migrating from shoulder to waist, the peak muscle forces of loading modes 1 to 4 were similar, while minimum peak muscle force occurred at loading mode 5 (shoulder load was 0% of body weight; waist load was 100% of body weight).
The trends of vastus and soleus forces in the gait cycle were similar. The vastus force was lower than soleus. The peak muscle forces occurred in the stance phase (Figures 5(c) and 5(d)). With the constraint loading migrating from shoulder to waist, the peak muscle forces of loading modes 1 to 4 were similar, while minimum peak muscle force occurred at loading mode 5.
Figure 5.
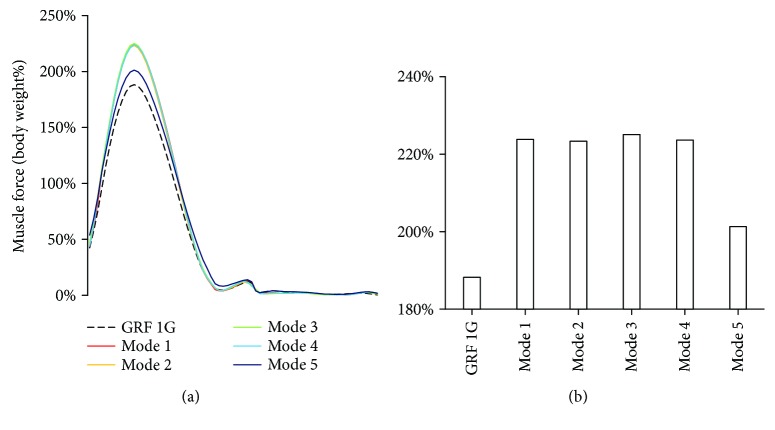
GRFs at gravity and five loading modes at weightlessness. The GRF was normalized with the body weight. The maximum GRFs at weightless condition were greater than those at gravity. (a) GRF curves in the full gait cycle under different loading conditions. (b) The maximum GRFs under different loading conditions.
In the rectus femoris, the peak muscle force occurred in the swing phase (Figure 4(e)). With the constraint loading migrating from shoulder to waist, the maximum muscle force changed slightly in loading modes 1 to 4 and decreased in loading mode 5.
3.3. Influence of Loading Mode on GRF
The GRF occurred only in stance phase because there is no contact with the ground during the swing phase. Only one peak of GRF was observed in the stance phase, inferring the non-heel-strike running in the present study (Figure 5(a). The peak GRF at gravity was 188% of body weight, which was lower than that at weightlessness (paired-samples t-test, p < 0.01). Among the loading modes at weightlessness, the minimum peak GRF occurred at loading mode 5. Peak GRFs at loading modes 1 to 4 were similar (Figure 5(b), Supplementary Material, Table S8).
4. Discussion
In the present study, a significant correlation (r = 0.757∗, p = 0.049) between the timings of peak muscle force and EMG was observed in the full gait cycle. These results provided the validity of the muscle force calculation. Previous studies on the treadmill constraint system mainly focused on the relationship between the resultant constraint loading and GRF, and the GRF was often regarded as an index of exercise strength. However, the present results indicated that although the resultant constraint loading was constantly equal to body weight, the GRF changed with the constraint loading modes. Minimum GRF occurred at loading mode 5 (shoulder load was 0% of body weight; waist load was 100% of body weight). Furthermore, although the GRF changed slightly in constraint loading modes 1 to 4, the muscle forces also changed with the constraint loading modes. These findings implied that resultant constraint force and GRF could not precisely reflect the muscle activity strength. The positions of the constraint loadings will influence the muscle forces in treadmill exercise, thus should be carefully considered in the optimization of exercise and the device design.
The forces of vastus and soleus had the similar trends as the GRF in the stance phase of the gait cycle, since they were all activated in this phase (Figure 4). The biceps femoris had the peaks in both the stance phase and swing phase, which correspond to its function; extension of hip joint in the stance phase; and flexion of knee joint in the swing phase. Half of the gastrocnemius muscle force was in the stance phase, and the other half was in the swing phase, which were a result of flexion of the knee when lifting the leg. Rectus femoris force was quite different among the subjects. This phenomenon may be related to the personalized exercise habits and needs to be further studied.
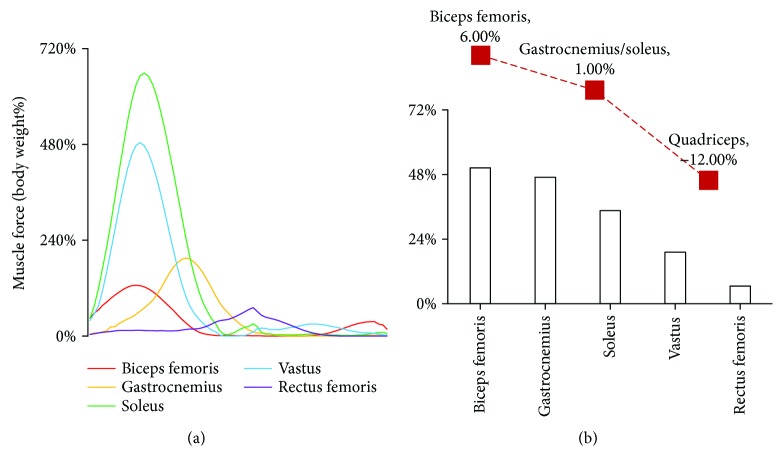
Under the constraint loadings at weightlessness, the maximum forces of the biceps femoris, gastrocnemius, and vastus at weightlessness (all five modes) were significantly greater than those at gravity (p < 0.01). Take constraint loading mode 3, for example, the peak muscle forces from high to low is as follows: soleus, vastus, gastrocnemius, biceps femoris, and rectus femoris (Figure 6(a)). However, based on the muscle force at gravity, the percent change in muscle forces from high to low is as follows: biceps femoris, gastrocnemius, soleus, vastus, and rectus femoris. The results were consistent with the muscle strength change after spaceflight (Figure 6(b)) [28]. In the biceps femoris, gastrocnemius, soleus, and vastus, maximum muscle force occurred at constraint loading mode 3 (loadings applied on the shoulder and waist were 50% of the body weight). While in the rectus femoris, maximum muscle force occurred at constraint loading mode 5 (waist load was 100% of the body weight). The findings indicated that the constraint loading mode could be manipulated to enhance the effect of muscle training at spaceflight.
Figure 6.
Muscle forces at weightlessness compared with those at gravity. (a) The curves of the five muscle forces at constraint loading mode 3; (b) the percent change in muscle forces based on the forces at gravity. The red curve is the postflight muscle concentric strengths compared with the preflight from NASA report [28]. The results were in agreement with the muscle atrophy observed in the astronaut.
The calculated curve of GRF in the gait cycle was consistent with the experimental data in the literature [29], which also provided a validation for the model calculation. Previous study has reported that the running speed had an impact on the GRF. The curve of GRF had two peaks in the stance phase when running at low speed, corresponding to heel strike and toe off. With increasing the speed, the GRF peak of heel strike will disappear [30]. A relatively high speed was applied in the treadmill countermeasure, which may lead to non-heel-striking running. Therefore, both the running speed and constraint loading mode can affect the muscle forces during treadmill exercise. The loading configuration (loading magnitude, direction, loading positions, etc.) should be adaptive to the running speed in the future design of constraint system.
The present study has some limitations. First, the resultant constraint loading was constantly equal to the body weight. The current constraint bungee cord in space flight is an elastic material, implying that the constraint loading changes linearly with the body height during running. However, previous studies proposed that a constant constraint loading may better prevent the musculoskeletal decline in spaceflight [14, 25], which could be achieved by manipulating the loading devices. Second, the kinematical data of treadmill exercise at gravity was also used to drive the musculoskeletal model at weightlessness, because weightless experiment has reported that the gait at weightlessness approached to the gait at gravity when the resultant constraint force increased to body weight on earth. And the influence of the constraint loading on the body kinematics would be investigated with the supine treadmill experiment in our future study.
5. Conclusion
The study indicated that maximum forces of the biceps femoris, gastrocnemius, and vastus under five loading modes at weightlessness were significantly greater than those at gravity (p < 0.01). The percentage changes in different muscle forces were in agreement with the muscle atrophy observed in astronauts. The results further revealed that the resultant constraint force and GRF could not precisely reflect the muscle activity strength. The constraint loading mode had an impact on the muscle forces in treadmill exercise, thus could be manipulated to enhance the effect of the muscle training at spaceflight.
Acknowledgments
This study was supported by The Open Foundation of State Key Laboratory (SMFA16K01), the National Natural Science Foundation of China (no. 11502014, 11421202), the Young Elite Scientist Sponsorship Program by CAST (YESS 2015QNRC001), the National Key Lab of Virtual Reality Technology, and the 111 Project (B13003). The authors thanked all the participants in this study.
Contributor Information
Jie Yao, Email: yaojie@buaa.edu.cn.
Yinghui Li, Email: yinghuidd@vip.sina.com.
Disclosure
The sponsor had no role in any aspect of the study, including data collection and analysis, manuscript preparation, or authorization for publication.
Conflicts of Interest
There are no conflicts of interest for this study.
Authors' Contributions
Ning Guo and Xingyu Fan are co-first authors.
Supplementary Materials
Figure S1: average and deviation of biceps femoris force in gait cycle in gravity and 5 loading modes. Figure S2: average and deviation of gastrocnemius force in gait cycle in gravity and 5 loading modes. Figure S3: average and deviation of vastus force in gait cycle in gravity and 5 loading modes. Figure S4: average and deviation of soleus force in gait cycle in gravity and 5 loading modes. Figure S5: average and deviation of rectus force in gait cycle in gravity and 5 loading modes. Table S1: ICC analysis in gait cycles. The table shows ICC analysis of each subject and five muscle force and GRF in gravity and 5 modes. Table S2: ICC analysis in 8 subjects. The table shows ICC analysis of 5 modes and gravity and 5 muscle force and GRF. Table S3: paired-samples t-test matrix of max biceps femoris force between different loading conditions. Table S4: paired-samples t-test matrix of max gastrocnemius force between different loading conditions. Table S5: paired-samples t-test matrix of max vastus force between different loading conditions. Table S6: paired-samples t-test matrix of max soleus force between different loading conditions. Table S7: paired-samples t-test matrix of max rectus femoris force between different loading conditions. Table S8: paired-samples t-test matrix of max GRF between different loading conditions.
References
- 1.Demontis G. C., Germani M. M., Caiani E. G., Barravecchia I., Passino C., Angeloni D. Human pathophysiological adaptations to the space environment. Frontiers in Physiology. 2017;8:p. 547. doi: 10.3389/fphys.2017.00547. [DOI] [PMC free article] [PubMed] [Google Scholar]
- 2.Lang T., van Loon J. J. W. A., Bloomfield S., et al. Towards human exploration of space: the THESEUS review series on muscle and bone research priorities. npj Microgravity. 2017;3(1):p. 8. doi: 10.1038/s41526-017-0013-0. [DOI] [PMC free article] [PubMed] [Google Scholar]
- 3.Trappe S., Costill D., Gallagher P., et al. Exercise in space: human skeletal muscle after 6 months aboard the International Space Station. Journal of Applied Physiology. 2009;106(4):1159–1168. doi: 10.1152/japplphysiol.91578.2008. [DOI] [PubMed] [Google Scholar]
- 4.Akima H., Kawakami Y., Kubo K., et al. Effect of short-duration spaceflight on thigh and leg muscle volume. Medicine and Science in Sports and Exercise. 2000;32(10):1743–1747. doi: 10.1097/00005768-200010000-00013. [DOI] [PubMed] [Google Scholar]
- 5.Lambertz D., Pérot C., Kaspranski R., Goubel F. Effects of long-term spaceflight on mechanical properties of muscles in humans. Journal of Applied Physiology. 2001;90(1):179–188. doi: 10.1152/jappl.2001.90.1.179. [DOI] [PubMed] [Google Scholar]
- 6.Sun L. W., Blottner D., Luan H. Q., et al. Bone and muscle structure and quality preserved by active versus passive muscle exercise on a new stepper device in 21 days tail-suspended rats. Journal of Musculoskeletal & Neuronal Interactions. 2013;13(2):166–177. [PubMed] [Google Scholar]
- 7.LeBlanc A., Schneider V., Shackelford L., et al. Bone mineral and lean tissue loss after long duration space flight. Journal of Musculoskeletal & Neuronal Interactions. 2000;1(2):157–160. [PubMed] [Google Scholar]
- 8.Belavy D. L., Adams M., Brisby H., et al. Disc herniations in astronauts: what causes them, and what does it tell us about herniation on earth? European Spine Journal. 2016;25(1):144–154. doi: 10.1007/s00586-015-3917-y. [DOI] [PubMed] [Google Scholar]
- 9.de Boer M. D., Seynnes O. R., di Prampero P. E., et al. Effect of 5 weeks horizontal bed rest on human muscle thickness and architecture of weight bearing and non-weight bearing muscles. European Journal of Applied Physiology. 2008;104(2):401–407. doi: 10.1007/s00421-008-0703-0. [DOI] [PubMed] [Google Scholar]
- 10.Lang T. F., Leblanc A. D., Evans H. J., Lu Y. Adaptation of the proximal femur to skeletal reloading after long-duration spaceflight. Journal of Bone and Mineral Research. 2006;21(8):1224–1230. doi: 10.1359/jbmr.060509. [DOI] [PubMed] [Google Scholar]
- 11.Hosoyama T., Ichida S., Kanno M., et al. Microgravity influences maintenance of the human muscle stem/progenitor cell pool. Biochemical and Biophysical Research Communications. 2017;493(2):998–1003. doi: 10.1016/j.bbrc.2017.09.103. [DOI] [PubMed] [Google Scholar]
- 12.Shiba D., Mizuno H., Yumoto A., et al. Development of new experimental platform ‘MARS’-Multiple Artificial-gravity Research System-to elucidate the impacts of micro/partial gravity on mice. Scientific Reports. 2017;7(1, article 10837) doi: 10.1038/s41598-017-10998-4. [DOI] [PMC free article] [PubMed] [Google Scholar]
- 13.Huang Y., Luan H., Sun L., Bi J., Wang Y., Fan Y. Local vibration enhanced the efficacy of passive exercise on mitigating bone loss in hindlimb unloading rats. Acta Astronautica. 2017;137:373–381. doi: 10.1016/j.actaastro.2017.05.008. [DOI] [Google Scholar]
- 14.Schneider S. M., Lee S. M. C., Feiveson A. H., Watenpaugh D. E., Macias B. R., Hargens A. R. Treadmill exercise within lower body negative pressure protects leg lean tissue mass and extensor strength and endurance during bed rest. Physiological Reports. 2016;4(15, article e12892) doi: 10.14814/phy2.12892. [DOI] [PMC free article] [PubMed] [Google Scholar]
- 15.Petersen N., Jaekel P., Rosenberger A., et al. Exercise in space: the European Space Agency approach to in-flight exercise countermeasures for long-duration missions on ISS. Extreme Physiology & Medicine. 2016;5(1):p. 9. doi: 10.1186/s13728-016-0050-4. [DOI] [PMC free article] [PubMed] [Google Scholar]
- 16.Guess T. M., Stylianou A. P., Kia M. Concurrent prediction of muscle and tibiofemoral contact forces during treadmill gait. Journal of Biomechanical Engineering. 2014;136(2, article 021032) doi: 10.1115/1.4026359. [DOI] [PMC free article] [PubMed] [Google Scholar]
- 17.Liu X., Ouyang J., Fan Y., Zhang M. A footwear–foot–knee computational platform for exploring footwear effects on knee joint biomechanics. Journal of Medical and Biological Engineering. 2016;36(2):245–256. doi: 10.1007/s40846-016-0126-z. [DOI] [Google Scholar]
- 18.Wu J. Z., Chiou S. S., Pan C. S. Analysis of musculoskeletal loadings in lower limbs during stilts walking in occupational activity. Annals of Biomedical Engineering. 2009;37(6):1177–1189. doi: 10.1007/s10439-009-9674-5. [DOI] [PubMed] [Google Scholar]
- 19.Bezodis N. E., Salo A. I. T., Trewartha G. Lower limb joint kinetics during the first stance phase in athletics sprinting: three elite athlete case studies. Journal of Sports Sciences. 2014;32(8):738–746. doi: 10.1080/02640414.2013.849000. [DOI] [PubMed] [Google Scholar]
- 20.Wang K.-Y., Wang S., Zhao W.-Y., Yin P.-C., Tang X.-Q. Effect of robot driving mode on lower limbs rehabilitative training. Advances in Engineering Research. 2016;105:622–627. [Google Scholar]
- 21.Farris D. J., Robertson B. D., Sawicki G. S. Elastic ankle exoskeletons reduce soleus muscle force but not work in human hopping. Journal of Applied Physiology. 2013;115(5):579–585. doi: 10.1152/japplphysiol.00253.2013. [DOI] [PubMed] [Google Scholar]
- 22.Horsman M. D. K. The Twente Lower Extremity Model. Enschede, The Netherlands: TMS International; 2007. [Google Scholar]
- 23.Jung Y., Jung M., Lee K., Koo S. Ground reaction force estimation using an insole-type pressure mat and joint kinematics during walking. Journal of Biomechanics. 2014;47(11):2693–2699. doi: 10.1016/j.jbiomech.2014.05.007. [DOI] [PubMed] [Google Scholar]
- 24.Fluit R., Andersen M. S., Kolk S., Verdonschot N., Koopman H. F. J. M. Prediction of ground reaction forces and moments during various activities of daily living. Journal of Biomechanics. 2014;47(10):2321–2329. doi: 10.1016/j.jbiomech.2014.04.030. [DOI] [PubMed] [Google Scholar]
- 25.Genc K. O., Mandes V. E., Cavanagh P. R. Gravity replacement during running in simulated microgravity. Aviation, Space, and Environmental Medicine. 2006;77(11):1117–1124. [PubMed] [Google Scholar]
- 26.Schaffner G., DeWitt J., Bentley J., Yarmanova E., Kozlovskaya I., Hagan D. Effect of Load Levels of Subject Loading Device on Gait, Ground Reaction Force, and Kinematics during Human Treadmill Locomotion in a Weightless Environment. Houston, TX, USA: National Aeronautics and Space Administration: Johnson Space Center; 2005. [Google Scholar]
- 27.Swanson S. C., Caldwell G. E. An integrated biomechanical analysis of high speed incline and level treadmill running. Medicine & Science in Sports & Exercise. 2000;32(6):1146–1155. doi: 10.1097/00005768-200006000-00018. [DOI] [PubMed] [Google Scholar]
- 28.Institute of Medicine (U.S.) Review of NASA’s Evidence Reports on Human Health Risks: 2014 Letter Report. Washington, DC, USA: The National Academies Press; 2015. [DOI] [PubMed] [Google Scholar]
- 29.Kluitenberg B., Bredeweg S. W., Zijlstra S., Zijlstra W., Buist I. Comparison of vertical ground reaction forces during overground and treadmill running. A validation study. BMC Musculoskeletal Disorders. 2012;13(1):p. 235. doi: 10.1186/1471-2474-13-235. [DOI] [PMC free article] [PubMed] [Google Scholar]
- 30.Jung Y., Jung M., Ryu J., Yoon S., Park S. K., Koo S. Dynamically adjustable foot-ground contact model to estimate ground reaction force during walking and running. Gait & Posture. 2016;45:62–68. doi: 10.1016/j.gaitpost.2016.01.005. [DOI] [PubMed] [Google Scholar]
Associated Data
This section collects any data citations, data availability statements, or supplementary materials included in this article.
Supplementary Materials
Figure S1: average and deviation of biceps femoris force in gait cycle in gravity and 5 loading modes. Figure S2: average and deviation of gastrocnemius force in gait cycle in gravity and 5 loading modes. Figure S3: average and deviation of vastus force in gait cycle in gravity and 5 loading modes. Figure S4: average and deviation of soleus force in gait cycle in gravity and 5 loading modes. Figure S5: average and deviation of rectus force in gait cycle in gravity and 5 loading modes. Table S1: ICC analysis in gait cycles. The table shows ICC analysis of each subject and five muscle force and GRF in gravity and 5 modes. Table S2: ICC analysis in 8 subjects. The table shows ICC analysis of 5 modes and gravity and 5 muscle force and GRF. Table S3: paired-samples t-test matrix of max biceps femoris force between different loading conditions. Table S4: paired-samples t-test matrix of max gastrocnemius force between different loading conditions. Table S5: paired-samples t-test matrix of max vastus force between different loading conditions. Table S6: paired-samples t-test matrix of max soleus force between different loading conditions. Table S7: paired-samples t-test matrix of max rectus femoris force between different loading conditions. Table S8: paired-samples t-test matrix of max GRF between different loading conditions.


