. 2018 Jan 8;9(8):2179–2187. doi: 10.1039/c7sc03913a

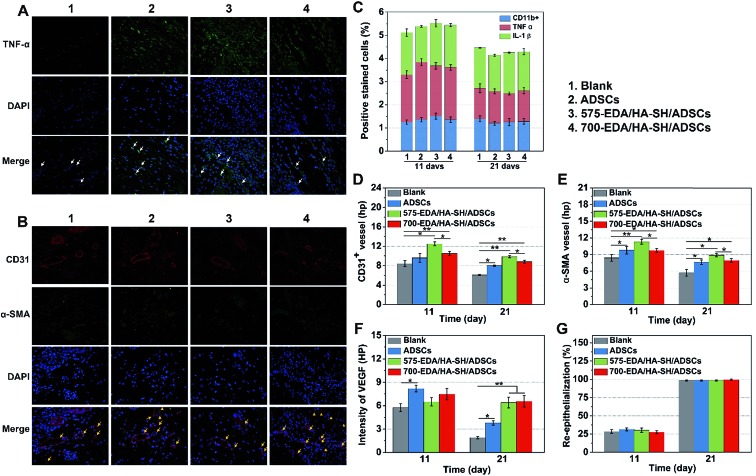
Fig. 5. The immuno-histochemical analysis of wound sections in nondiabetic wound beds at scheduled time points. (A) Representative immunofluorescent images of tissue sections at 11 days post-wounding stained for TNF-α (green) and DAPI staining for nuclei (blue). (B) CD31 (for the endothelial marker, red), α-SMA (for the endothelial myofibroblast marker, green), and DAPI (for cell nuclei, blue) stained images (21 days post-wounding). The yellow triangles represent CD31+/α-SMA– vessels, and the yellow arrows represent CD31+/α-SMA+ vessels. Scale bar: 100 μm. (C)–(G) The quantification analysis of the positive stained inflammatory cytokines, which indicates total cellular infiltration into the constructs or wound areas as well as an immune response in the surrounding tissue. (B) and (C) The quantification analysis of blood vessels based on the CD31 and α-SMA positive stained vasculature. (D) The intensity of the VEGF expression in each experimental group. (E) The quantification analysis of the re-epithelialization rate (n = 16 wounds per treatment group). *p < 0.05; **p < 0.01.

Fig. 5