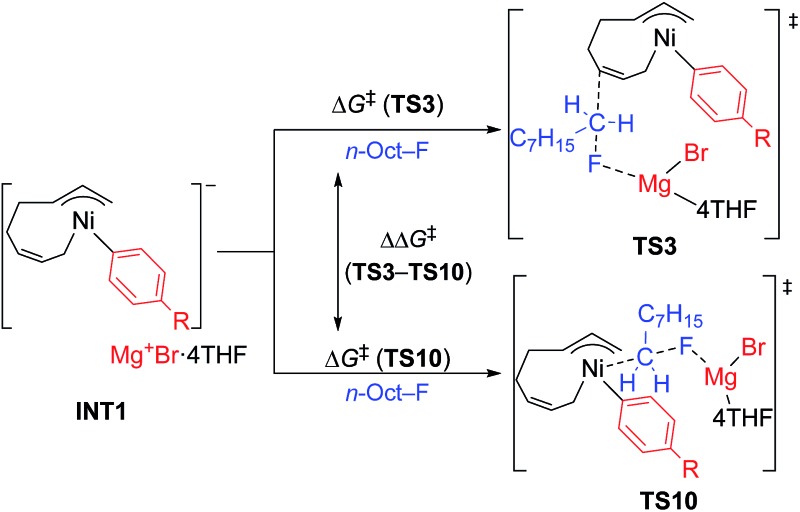
Table 10. The difference in calculated energy barriers (in kJ mol–1) of TS3 and TS10 based on p-RC6H4MgBr and n-OctF.

| ||||||
| R | H | F | Cl | Me | OMe | NMe2 |
| ΔΔG‡ | 6.5 | –2.7 | –1.9 | 5.0 | 5.0 | 8.9 |
| Exp. ratio (4/3) | 1.4 | 0.60 | 1.0 | 1.9 | 2.3 | 3.3 |

| ||||||
| R | H | F | Cl | Me | OMe | NMe2 |
| ΔΔG‡ | 6.5 | –2.7 | –1.9 | 5.0 | 5.0 | 8.9 |
| Exp. ratio (4/3) | 1.4 | 0.60 | 1.0 | 1.9 | 2.3 | 3.3 |