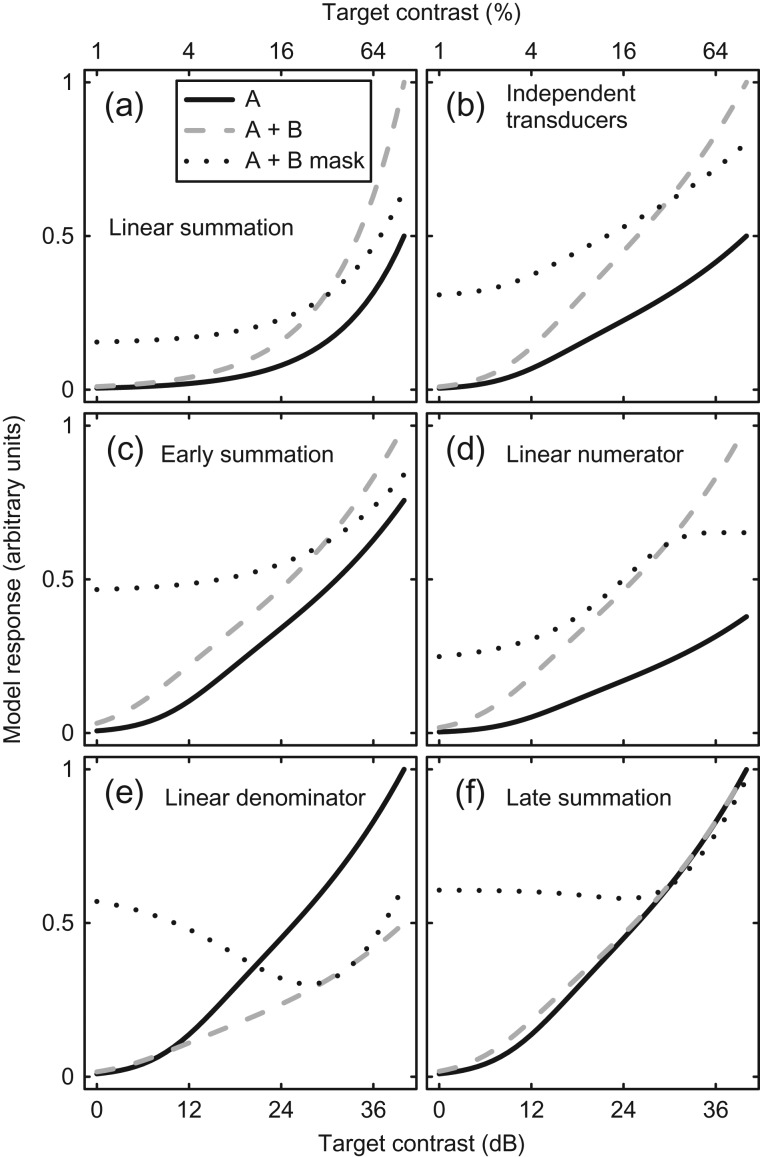
Figure 2.
Predictions of six models of signal combination (a–f). In each panel, the model responses to a single input (A, solid curves) or two inputs (A + B, dashed curves) are compared as a function of component contrast. The dotted curves show a further condition in which a fixed signal is shown to one channel (B) and the input to the other channel (A) is increased. The individual models are described in the text. All models are normalized to the largest response at 100% input contrast across the three conditions.

