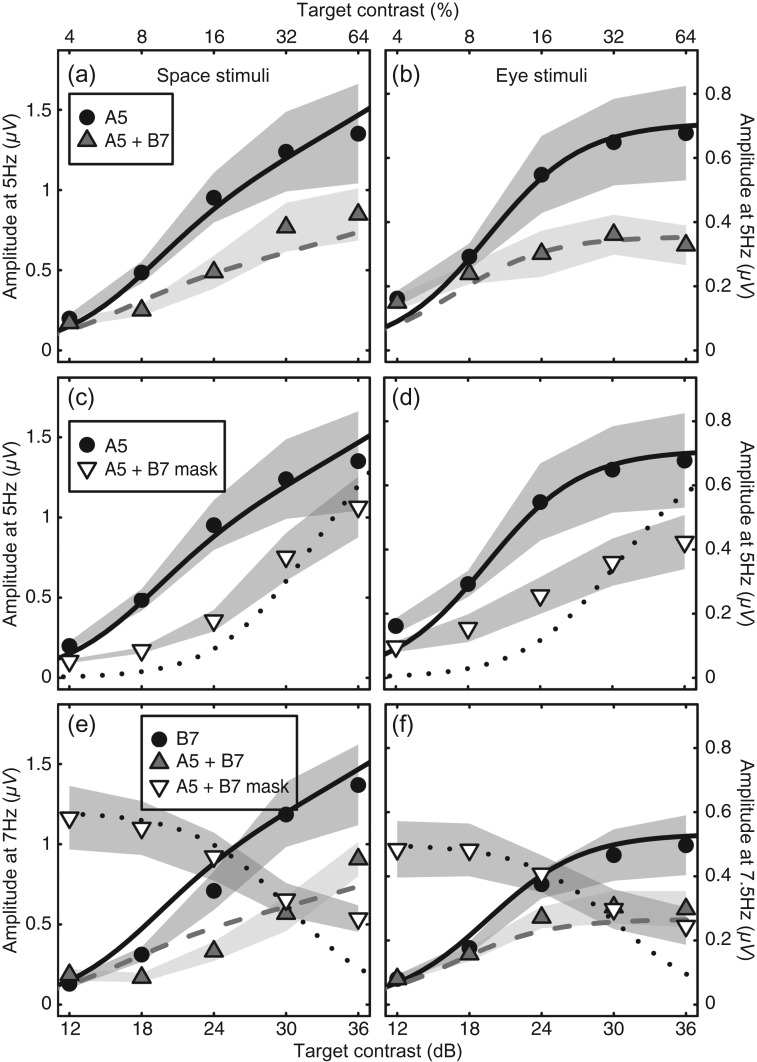
Figure 4.
(a–d) SSVEP responses at the target frequency (5 Hz) when the mask (B component) flickered at a higher frequency (7 Hz for the space condition (a,c) and 7.5 Hz for the eye condition (b,d)). (e,f) SSVEP responses at the mask frequency (7 or 7.5 Hz) when the target flickered either at 7/7.5 Hz (circles) or at 5 Hz (with a mask at the higher frequency). In each panel, the shaded regions indicate ±1 SE of the mean of each data point. The curves are predictions of the late summation model with no free parameters (except in [f], where Rmax was permitted to vary).

