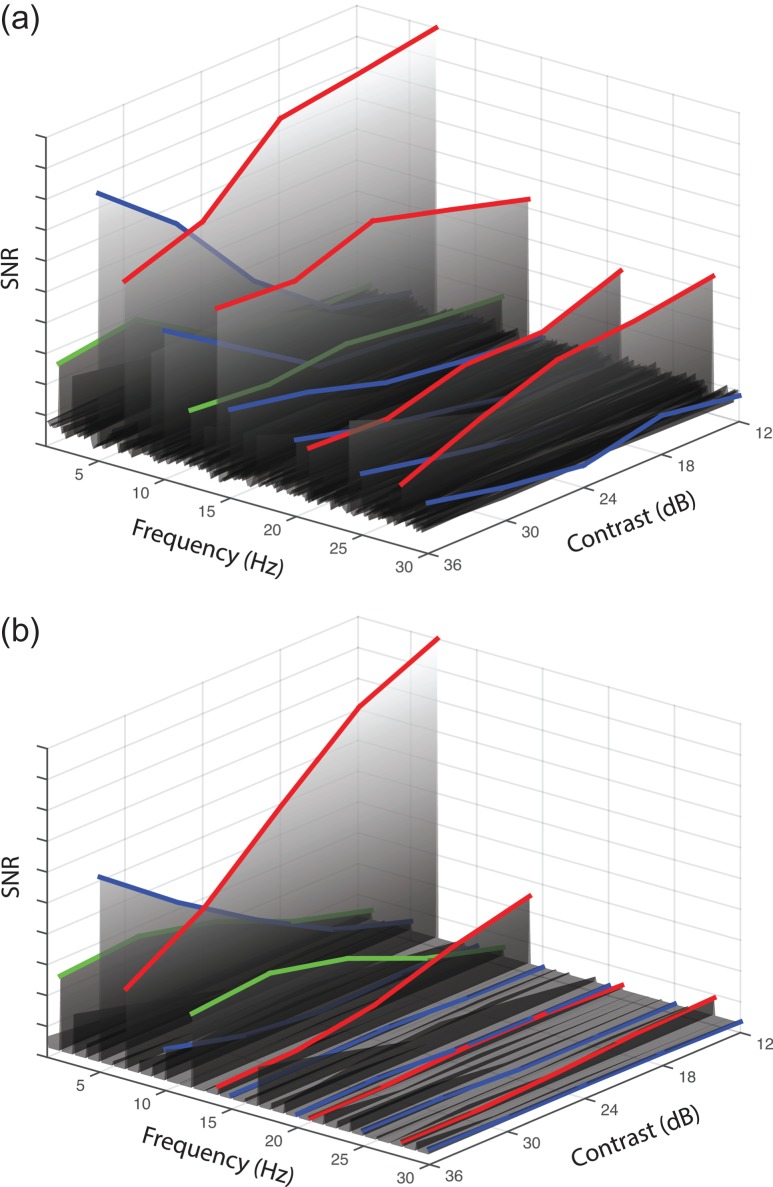
Figure 6.
Surface plots showing empirical (a) and model (b) SNRs as a function of frequency (left abscissa) and contrast (right abscissa). The condition was the A5 + B7 mask condition from the space experiment, in which the 7 Hz mask component had a fixed contrast of 32%, and the 5 Hz target component contrast increased along the right abscissa. The blue-highlighed functions indicate the target frequency (5 Hz) and its harmonics. The red-highlighted functions indicate the mask frequency (7 Hz) and its harmonics. Green-highlighted functions indicate the intermodulation frequencies (7−5 = 2 Hz and 7 + 5 = 12 Hz). In the human data, the higher harmonics produce relatively larger amplitudes than in the model. Model parameters are given in the caption to Figure 3.

