
Fig. 8.
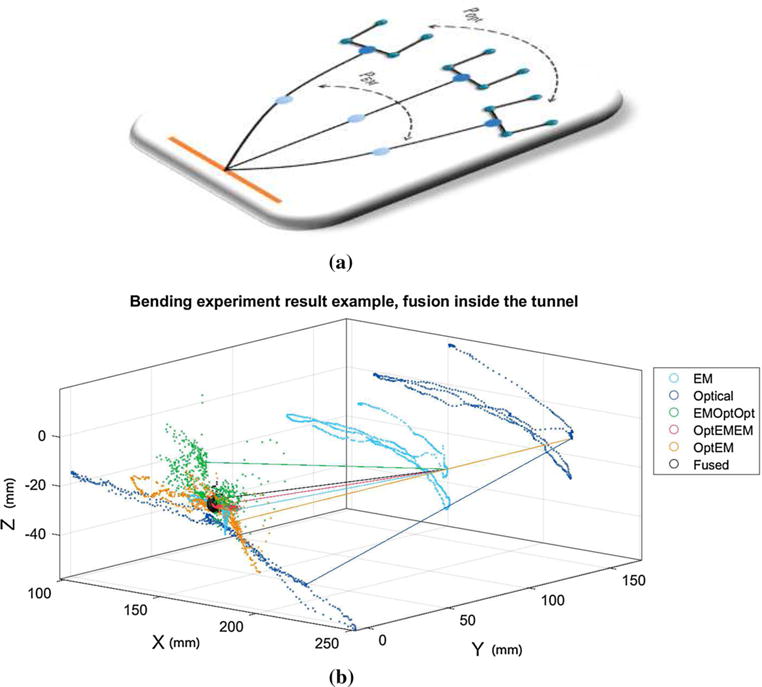
Single experimental result: Each scattered point stands for a single time step record. The left-side points are the estimated tip position using different methods, and the right-side points represent the raw EM or optical measurements. The black sphere is centered at the gold standard point and encompasses 90% of the fusion result points (black points). The lines in the figure illustrate the correlation between different methods at a single time step. They link the estimated tip position to the measured EM or needle base (optical) locations. a Diagram representation of needle bending experiment. b Numerical representation of needle bending experiment