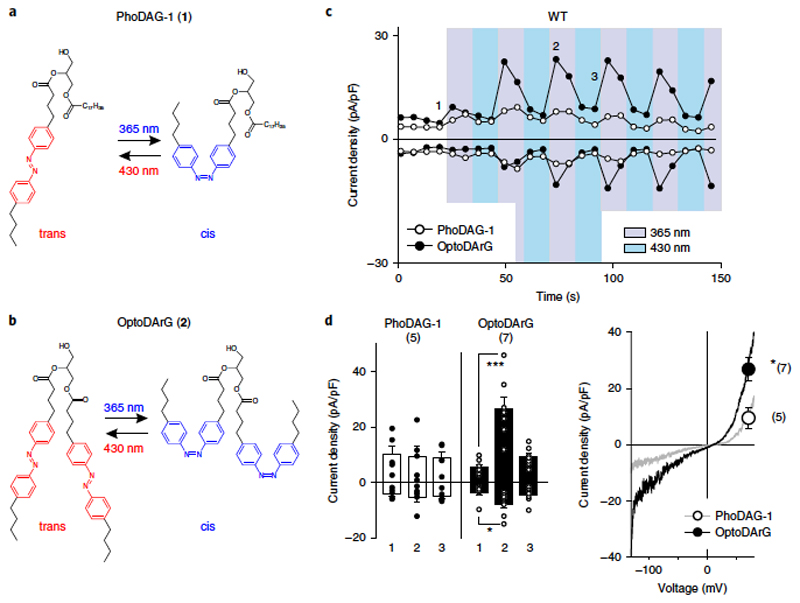
Figure 1. Optical control of TRPC3 conductances expressed in HEK293 cells by DAG photoswitches.
a,b, Chemical structures of photoswitchable DAGs:PhoDAG-1 (ref. 18) (1; a) and the newly synthesized OptoDArG (2; b; Supplementary Note). c, Representative time courses of the TRPC3-WT conductances recorded at − 90 mV and + 70 mV during repetitive photoconversion of PhoDAG-1 (400 μM, open circles) and OptoDArG (30 μM, closed circles). UV (365 nm; violet) and blue light (430 nm; blue) irradiation are indicated, with each pulse maintained for 10 s. Time points corresponding to mean values given in d for basal (before illumination; 1), activation (2) and deactivation (3) are indicated. d, Left panel, current densities induced by photoconversion of PhoDAG-1 (400 μM, white) and OptoDArG (30 μM, black) are shown for TRPC3-WT and G652A (at − 90 mV and + 70 mV; mean ± s.e.m. are shown; N = numbers of cells measured, indicated in parentheses) at time points (1,2,3) given in c; two-tailed t-test (normally distributed values) or Mann–Whitney rank sum test (non-normally distributed values) were applied and significant difference at *P < 0.05; ***P < 0.001 are indicated; if no P value is given, comparison with basal (1) current levels is not significant. Values from individual experiments are shown for each of the columns (circles). Right panel, representative current to voltage relations of the PhoDAG-1 and OptoDArG-induced currents as obtained by voltage-ramp protocols measured at blue light irradiation (cis photoconversion) at + 70 mV. Mean current densities ± s.e.m. (N = number of cells measured, indicated in parentheses; corresponding to left panel) for PhoDAG-1 (open circle) and OptoDArG (closed circle); *P = 0.016.

