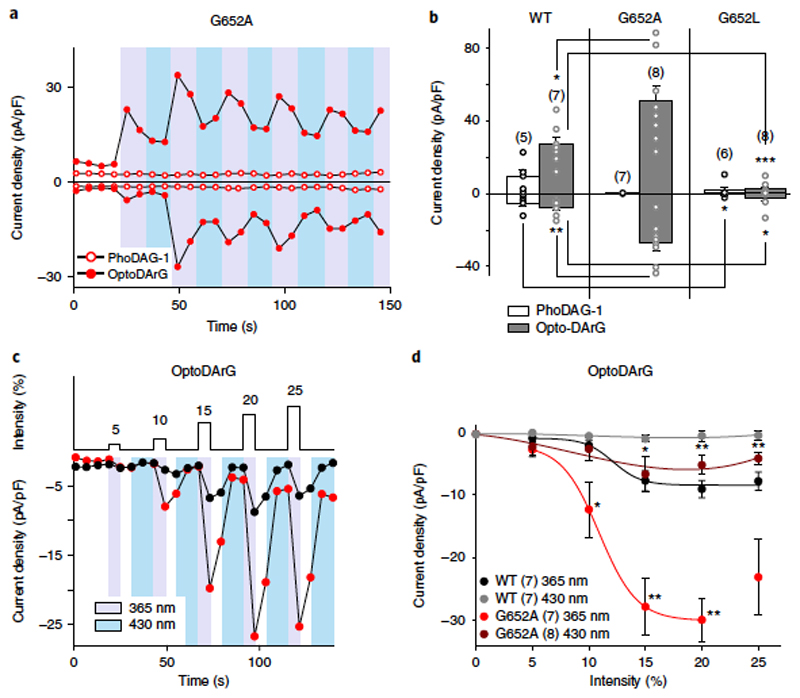
Figure 5. Photopharmacological determination of the DAG sensitivity of TRPC3-WT and G652A channels.
a) Representative time course of the G652A conductance recorded at − 90 mV and + 70 mV during the repetitive photoconversion of PhoDAG-1 (400 μM, open circles) and OptoDArG (30 μM, closed circles). UV (365 nm; violet) and blue light (430 nm; blue) irradiation is indicated, with each pulse maintained for 10 s. Mean values ± s.e.m. are shown for peak; net-current responses are shown in b. b) Current densities (at − 90 mV and + 70 mV; mean ± s.e.m.; N = number of cells measured, indicated in parentheses) at the maximum, net responses induced by PhoDAG-1 (400 μM, white) and OptoDArG (30 μM, gray) are shown for TRPC3-WT and G652A. Data are mean ± s.e.m.; N = number of cells measured, as indicated; two tailed t-test (non-normally distributed values) or Mann–Whitney test (nonnormally distributed values) were applied and significant differences at *P < 0.05; **P < 0.01; ***P < 0.001 are indicated; if no P level is given, comparison with WT (PhoDAG-1) is not significant (P > 0.05). Values from individual experiments are shown for each of the columns (circles). Individual values are shown for each of the columns (circles). c) Representative responses to increasing light intensity (maximal output power, 670 mW) of TRPC3-WT-(black) and G652A-(red) expressing HEK293 cells induced by photoisomerization of OptoDArG (30 μM). UV (365 nm, violet, pulse held for 2 s) and blue light (430 nm, blue, pulse held for 10 s) are shown. d) Light intensity: current density relation for TRPC3-WT (peak inward current, black; minimum current level during deactivation, gray) and G652A (peak inward current, red; minimum current level during deactivation, deep red) obtained by photoisomerization of OptoDArG (30 μM). Mean ± s.e.m. are shown; N = number of cells measured are indicated; two tailed t-test (non-normally distributed values) or Mann-Whitney tests (non-normally distributed values) were applied; significant difference in comparison to WT indicated at *P < 0.05 and **P < 0.01.

