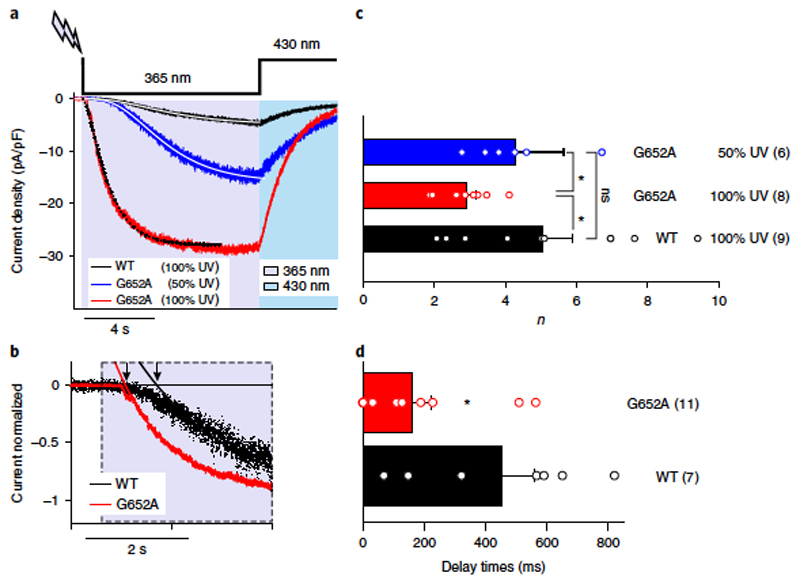
Figure 6. Optical cycling of TRPC3-WT and G652A mutant channels in the presence of OptoDArG (30 μM) occurs with divergent kinetics.
a) Representative traces showing the inward currents induced by OptoDArG (30 μ M) in a whole-cell, gap-free recording (holding potential: − 40 mV, normalized by capacitance) in TRPC3-WT and G652A-expressing HEK293 cells. UV: 365 nm, violet; blue light: 430 nm, blue. TRPC3-WT (black) and G652A (red) responses were induced with 100% intensity of UV, and G652A (blue) was triggered with 50% UV. Exponential fits of current activation for TRPC3-WT (black, 100%), G652A (red, 100%) and G652A (blue, 50%) are shown. b) Exponential fits of the initial phase of current activation for TRPC3-WT (black) and G652A (red). Signal was normalized to peak current. The delay of current activation derived from monoexponential fits is indicated by black arrows. c) Power (n) of power-exponential fitting is shown (f = A*(1-exp(− x/tau))n). Data are mean ± s.e.m.; N = number of cells, indicated in parentheses; two-tailed t-test or Mann-Whitney tests were applied; ns, not significant in comparison to WT. d) Histogram displaying the current activation delay for TRPC3-WT (black) and G652A (red). Data are mean ± s.e.m.; N = number of cells measured, indicated in parentheses; two-tailed t-test or Mann-Whitney test were applied; *P < 0.05. Values from individual experiments are shown for each of the columns (circles).

