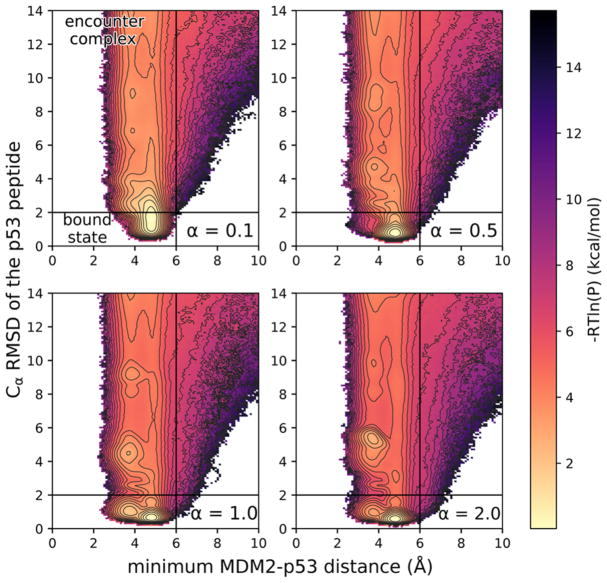
Figure 2.
Zoomed-in views of probability distributions over the WE progress coordinate for various extents of structure in the p53 peptide, ranging from fully disordered (α = 0.1) to fully preorganized (α = 2.0) (for a representative full view of the probability distribution, see Figure S4). The progress coordinate consisted of the Cα RMSD of the p53 peptide after alignment of MDM2 from the crystal structure of the MDM2–p53 peptide complex29 and minimum MDM2–p53 distance. Definitions of the encounter complex and bound state are delineated by the solid black lines (for a representative full view of the probability distribution, see Figure S4). The color scale represents –RT ln P where P is the pseudoequilibrium probability density based on trajectory weights from each of 10 independent WE simulations that were carried out for the corresponding MDM2– p53 system (see Methods). Contour lines represent intervals of 0.5 kcal/mol.

