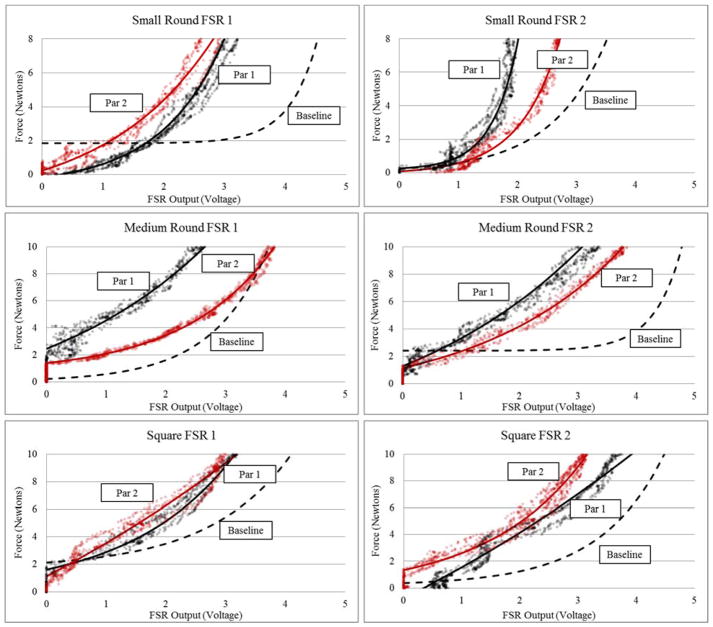
Figure 6. Participant Testing Data for Individual FSR Sensors.
Calibration curves plotted for each sensor and participant against the previously determined baseline calibration curve (under room temperature, flat, rigid conditions), where Par 1 and Par 2 abbreviates participant 1 and participant 2 respectively. Participant calibration curves are transposed over the raw force-voltage data.

