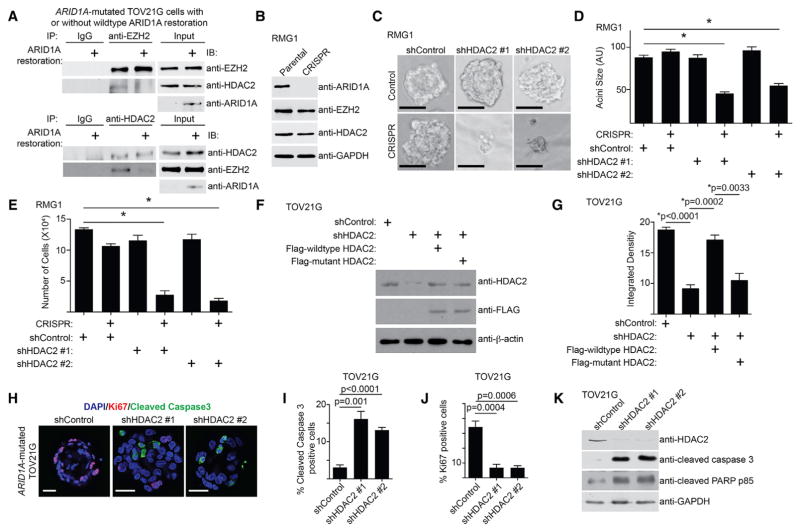
Figure 1. HDAC2 Inhibition Suppresses Cell Growth and Induces Apoptosis in ARID1A-Inactivated Cells.
(A) ARID1A-mutated TOV21G cells with or without wild-type ARID1A restoration were subjected to co-immunoprecipitation (coIP) analysis using antibodies against EZH2 or HDAC2 or an immunoglobulin G (IgG) control. Immunoblots of the indicated proteins were performed.
(B) Immunoblot of the indicated proteins in parental and ARID1A CRISPR RMG1 cells.
(C) Indicated cells were grown in 3D using Matrigel. Scale bars, 75 measurable units (a.u.) using NIH ImageJ software.
(D) Quantification of the diameter of acini formed by the indicated cells in 3D culture. *p < 0.05. n = 3.
(E) Quantification of the number of cells recovered from 3D culture of the indicated cells. *p < 0.05. n = 3.
(F) ARID1A-mutated TOV21G cells with endogenous HDAC2 knockdown using a shRNA that targets the 3′ UTR region of the human HDAC2 gene were concurrently expressing a FLAG-tagged, shRNA-resistant wild-type HDAC2 or a catalytically inactivated H142A HDAC2 mutant. Expression of HDAC2, FLAG, and β-actin was determined by immunoblot.
(G) Same as (F), but the indicated cells were subjected to growth analysis using the colony formation assay. Integrated density of colonies formed by the indicated cells was quantified. n = 4.
(H) Immunofluorescence staining of Ki67 (red), cleaved caspase-3 (green), and DAPI (blue) of the acini formed by ARID1A-mutated TOV21G cells with or without HDAC2 knockdown in 3D culture on day 12. Scale bars, 20 μm.
(I and J) Quantification of (H). 200 cells from each indicated group were examined for expression cleaved caspase-3 (I) or Ki67 (J). n = 3.
(K) ARID1A-mutated TOV21G cells with or without HDAC2 knockdown were examined for expression of markers of apoptosis cleaved caspase-3 and cleaved PARP p85, HDAC2, and GAPDH by immunoblot.
Error bars represent the SEM p value calculated with two-tailed t test. See also Figure S1.

