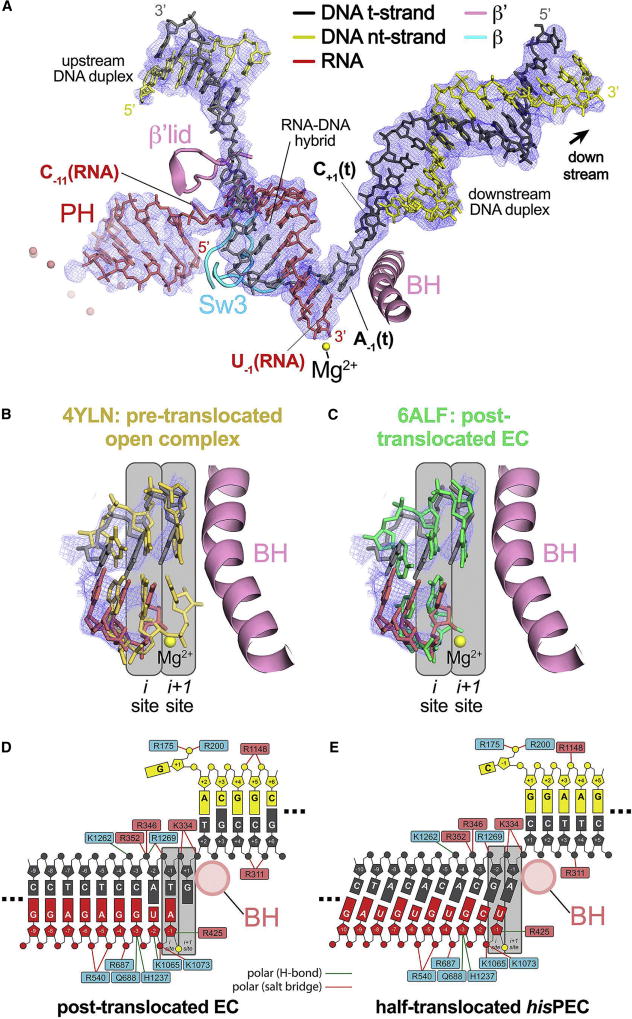
Figure 2. The hisPEC is trapped in a half-translocated state unable to load NTP substrate.
(A) The 3.8 Å resolution hisPEC cryo-EM density map (blue mesh) with the superimposed model of only the hisPEC nucleic acids. Shown for reference are key RNAP structural elements (Sw3, lid, BH) and the RNAP active-site Mg2+-ion (yellow sphere).
(B) Comparison of the half-translocated hisPEC RNA-DNA hybrid (RNA, red; t-strand DNA, dark gray) proximal to the RNAP active site (active-site Mg2+-ion shown as a yellow sphere) with the pre-translocated hybrid of 4YLN (yellow; Zuo and Steitz, 2015). The hisPEC cryo-EM density map is superimposed (blue mesh). Also shown for reference is the hisPEC BH. The RNAP active site i and i+1 sites are denoted schematically (gray boxes).
(C) Same as (B) but the half-translocated hisPEC RNA-DNA hybrid is compared with the post-translocated hybrid of 6ALF (green; Kang et al., 2017).
(D) Schematic illustration showing the active-site proximal nucleic acids and key protein/nucleic acid interactions for the post-translocated EC (6ALF; Kang et al., 2017). RNAP β subunit residues are denoted in cyan boxes, β′ residues in pink boxes. The BH (pink circle), the active site Mg2+-ion (yellow circle), and the i and i+1 sites (gray boxes) are also denoted.
(E) Same as (D) but showing the active-site proximal nucleic acids and key protein/nucleic acid interactions for the half-translocated hisPEC.
See also Figure S3.

