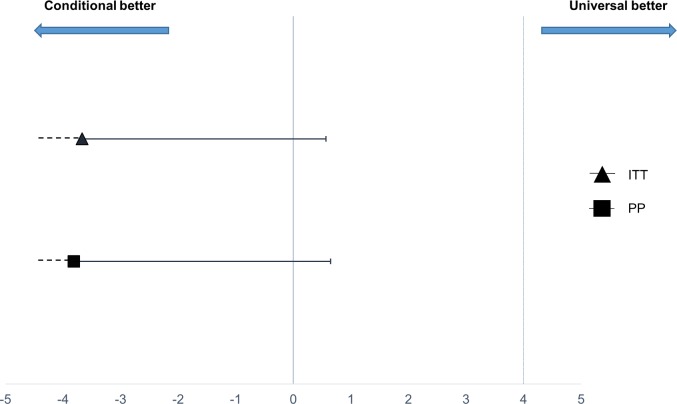
Fig 2. Non-inferiority plot comparing treatment failure outcome at 1 week in the conditional and universal follow-up arms.
The point estimates of the risk difference in treatment failure at day 8 and their respective upper 95% confidence intervals are displayed in black. The dotted vertical line shows the predefined inferiority margin of 4%. In none of the performed analyses was the non-inferiority margin exceeded. ITT, intention-to-treat; PP, per-protocol.

