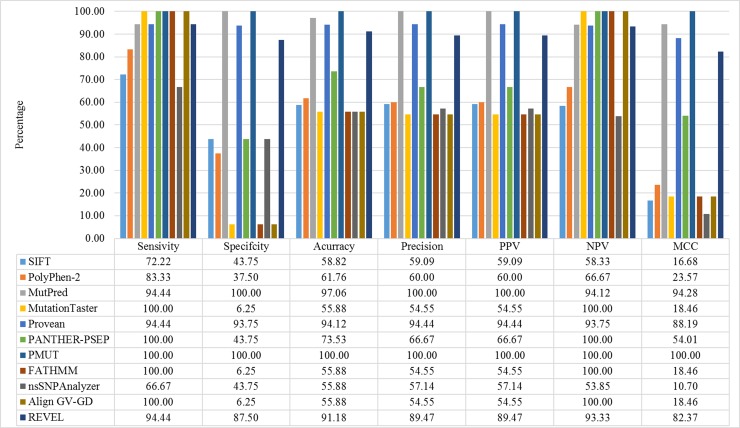
Fig 2. Reliability of eleven in silico programs used to analyze all 18 functionally characterized missense variants in PITX2.
True positives (TP) are missense variants correctly predicted to disrupt PITX2 protein function, and false negatives (FN) are those incorrectly predicted to be benign or tolerated. True negatives (TN) are neutral variants correctly predicted as benign or tolerated and false positives (FP) are neutral variants incorrectly predicted to disrupt PITX2 protein function. The total of variants for all methods was 34, 18 pathogenic variants and 16 benign variants. Values were converted to percentage. Values were converted to percentage. The statistics used were calculated as follows: Sensitivity = TP/(TP + FN); Specificity = TN/(TN + FP); Accuracy = (TP + TN)/(TP + TN + FP + FN); Precision = TP/(TP + FP); Negative predictive value (NPV) = TN/(TN + FN); Positive predictive value (PPV) = TP/(TP + FP); Matthews correlation coefficient (MCC) = (TP × TN − FP × FN)/-([TP + FP] × [TP + FN] × [TN + FP] × [TN + FN]R).

