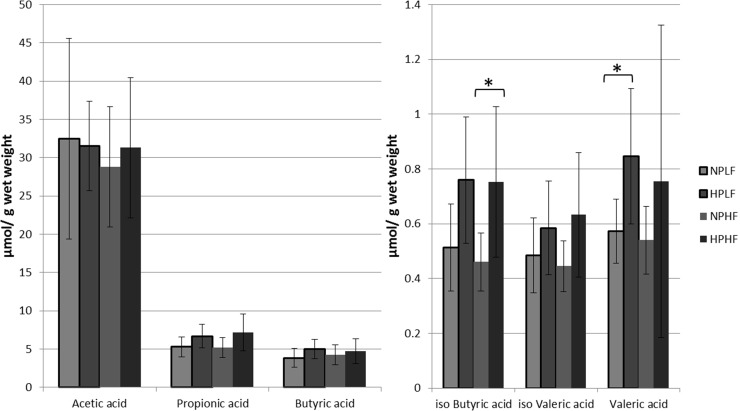
Fig 1. Caecal luminal SCFA concentrations in μmol/g content measured with gas chromatography.
* Indicates significance between two groups (Ttest, P < 0.05). In light grey are both the normal protein diets: Normal Protein-Low Fat (NPLF) and Normal Protein-High Fat (NPHF). In dark grey are both the high protein diets: (High Protein-Low Fat (HPLF) and High Protein-High Fat (HPHF).

