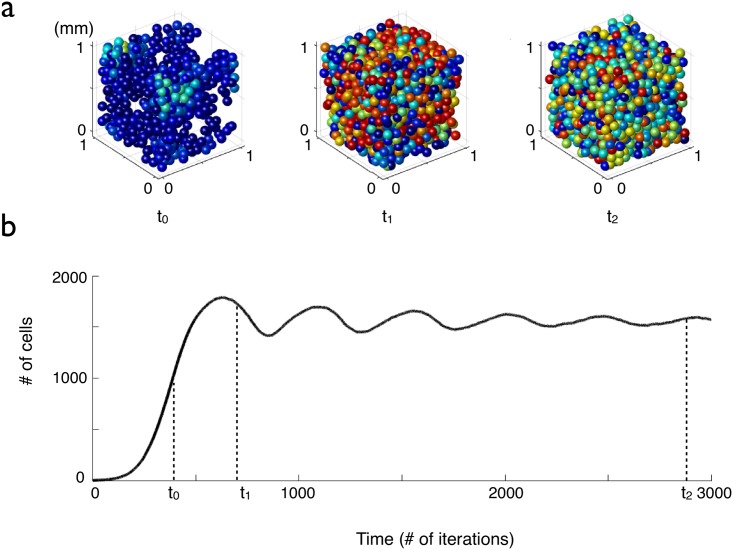
Fig 2. Evolution of the cell density versus time for cells with a fixed lifetime clock threshold.
The proliferation parameter is λ = 0.05 per iteration and the lifetime threshold is D = 400 iterations. (a) The cells are represented by spheres whose color is correlated to the value of their lifetime clock: blue cells have been created recently and have a low lifetime clock, whereas red cells are close to the lifetime threshold. (b) Cell number versus time (average over 10 simulations, the error bars are smaller than the thickness of the line).

