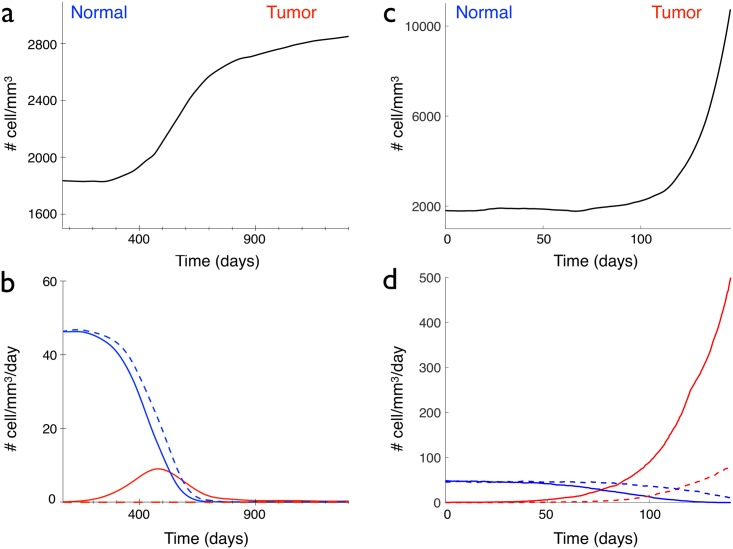
Fig 5. Comparison of the different scenarios of glioma appearance.
(a) and (b), an immortal cell appears at time t = 0, (c) and (d), a cell without contact inhibition appears at time t = 0. (a) and (c) Temporal evolution of the total cell density. (b) and (d) Normal (blue lines) and tumoral (red lines) proliferating (plain curve) and disappearing (dashed curve) cell densities, in a 1 mm3 cube.

