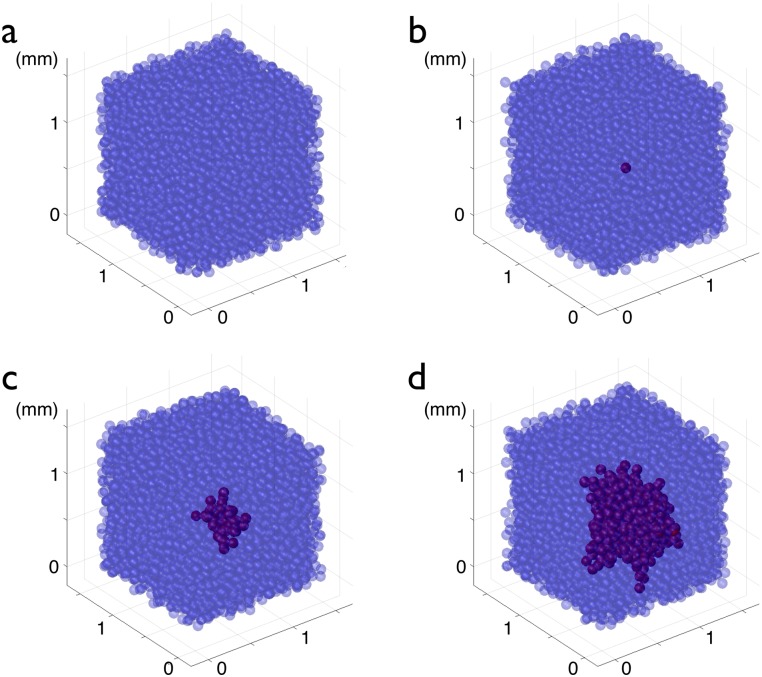
Fig 6. Formation of a glioma by the appearance of an over proliferating cell.
(a) Normal OPCs (blue) at equilibrium proliferate (ρ = 0.05/h) and differentiate, as described in the text. In (b), a newly created cell is characterized by an over-proliferating (ρ = 0.25/h) phenotype, in red (t = 0). The daughters of this abnormal cell keep the over-proliferating character. In (c) the system is represented at t = 1500 h = 62.5 days, the developing glioma appears in dark red; in (d) the system is represented at t = 3000 h = 125 days.

