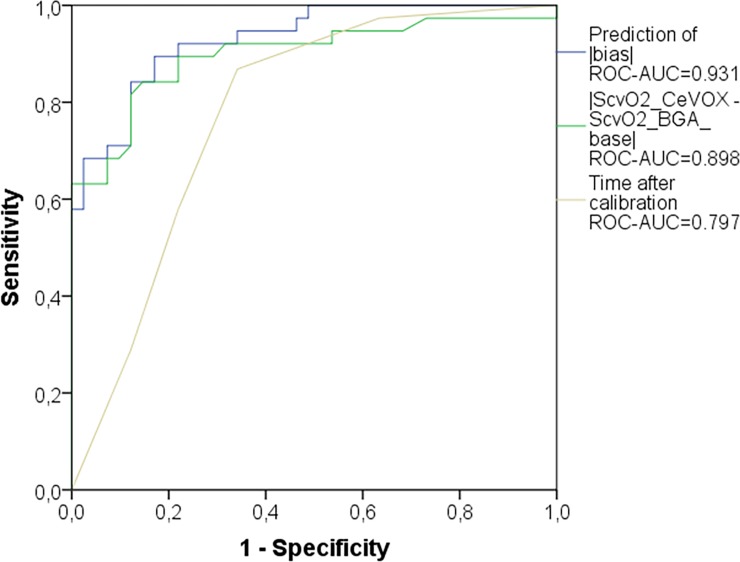
Fig 5. ROC curve comparing different predictors of |ScvO2_CeVOX–ScvO2_BGA| ≥5% in the evaluation group (n = 80).
“Prediction of |bias|”: model predicting |ScvO2_CeVOX–ScvO2_BGA| which was derived from multiple regression analysis within the evaluation group. ROC: receiver operating characteristic. AUC: area under the curve. ScvO2_CeVOX: Central venous oxygen saturation derived from the CeVOX-device. ScvO2_BGA: Central venous oxygen saturation derived from blood gas analysis.

