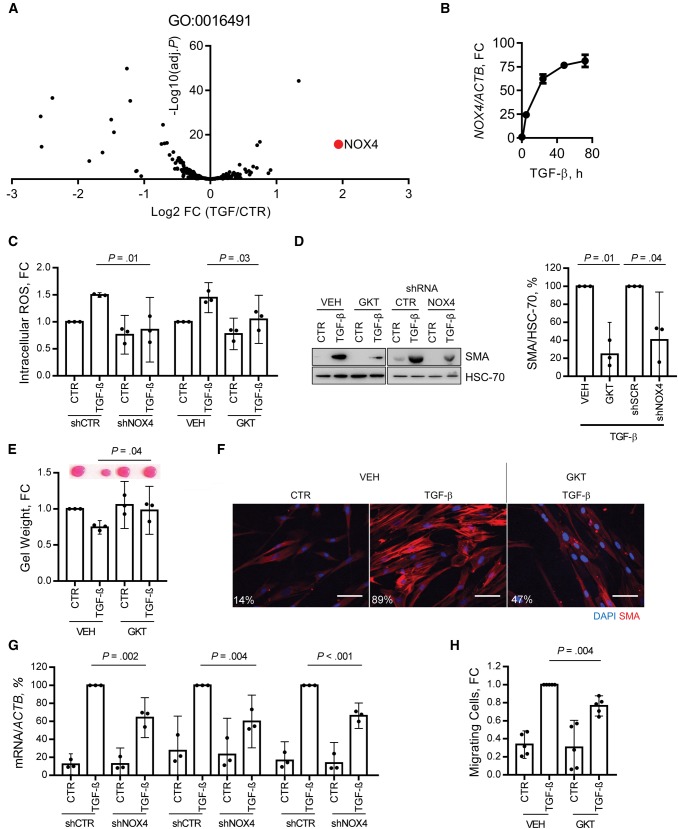
Figure 2.
Role of NOX4 in fibroblast-to-myofibroblast transdifferentiation. A) Volcano plot showing changes in the expression of genes within the gene ontology term “oxidoreductase activity” (GO: 0016491) in human fetal foreskin fibroblasts (HFFF2s) treated with transforming growth factor (TGF)–β (2 ng/mL, seven days), analyzed by RNA sequencing. NOX4 is identified in red. B) Quantitative polymerase chain reaction (Q-PCR) analysis of NOX4 mRNA expression following TGF-β (2 ng/mL) treatment in HFFF2s. C–G) Analysis of TGF-β-induced ROS and myofibroblast differentiation in HFFF2s following NOX4 inhibition either by GKT137831 (GKT; 20 µM) or lentiviral mediated transduction of shRNA targeting NOX4 (MOI = 20; knockdown confirmed in Supplementary Figure 2F, available online). C) Flow cytometry analysis of dichlorofluorescein-diacetate (DCFH-DA) fluorescence at 48 hours from TGF-β treatment (mean +/− 95% CIs from three independent experiments; statistical significance was assessed by two-tailed homoscedastic t test). D) Immunoblotting for α-smooth muscle actin (SMA) expression. A representative blot is shown with densitometry quantification (mean +/− 95% CIs from three independent experiments; statistical significance was assessed by two-tailed t test with Welch’s correction). E) Representative images and quantification from collagen gel contraction assays (mean +/− 95% CIs from three independent experiments; statistical significance was assessed by two-tailed homoscedastic t test). F) Immunofluorescent cytochemistry staining for α-SMA stress fibers. The percentage of cells positive for α-SMA stress fibers in each condition is also shown. G) Q-PCR analysis of extracellular matrix–related gene expression (mean +/− 95% CIs from three independent experiments; statistical significance was assessed by two-tailed t test with Welch’s correction). H) HNSCC cell line (5PT) migration toward conditioned media generated by HFFF2s treated as indicated with TGF-β (2 ng/mL, 72 hours), and/or GKT137831 (20 µM), in a Transwell migration assay (mean +/− 95% CIs from four independent experiments; statistical significance was assessed by two-tailed t test with Welch’s correction). Scale bar represents 50 µm. (***P < .001). Please see Supplementary Figure 2 (available online) for more information. FC = fold change; TGF = transforming growth factor.

