Figure 3.
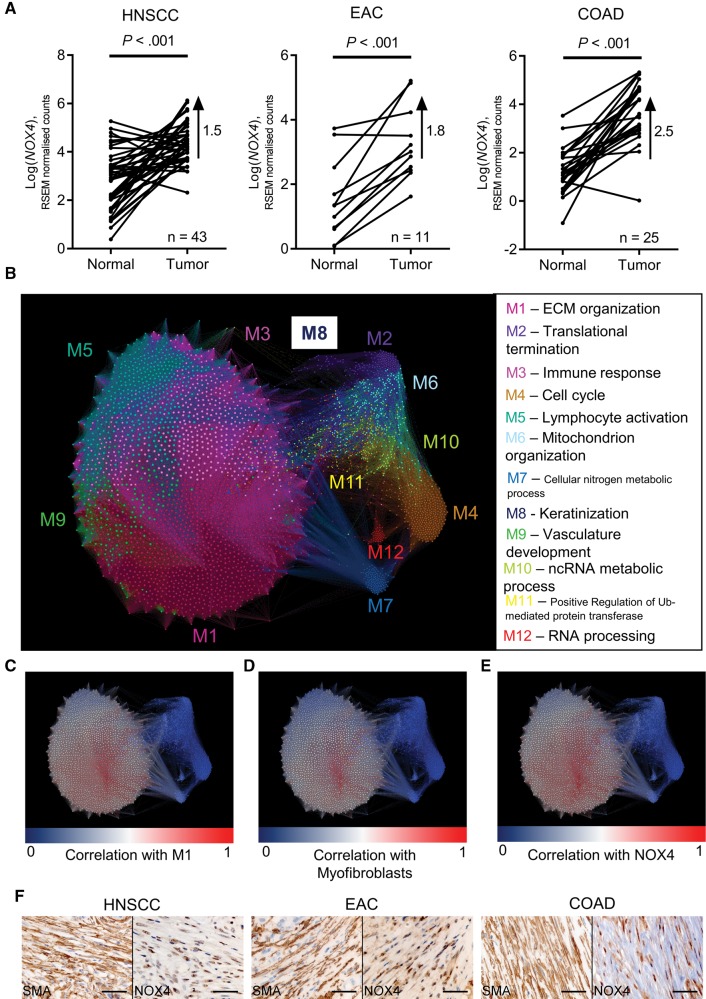
Analysis of NOX4 expression in different cancers. A–E) Analysis of RNASeq data from The Cancer Genome Atlas database. A) Log-transformed RSEM normalized count (NOX4) expression in patient-matched normal and tumor samples. Statistical significance was assessed using two-sided paired t tests. The difference between means is also shown. B–E) Network map showing a consensus-weighted gene correlation network, constructed from head and neck squamous cell carcinoma (HNSCC), esophageal adenocarcinoma (EAC), and colon adenocarcinoma (COAD) primary tumor samples. Each node on the network map represents a single gene, and the size of each node represents the connectivity of this gene within the network. B) Nodes are colored according to module membership, and the most statistically significantly associated biological function for each module is shown. C–E) Nodes are colored according to the degree of correlation (blue-white-red scale represents r values increasing from 0 to 1) to the extracellular matrix (ECM) module eigengene (C); to the Mellone_TGF_UR myofibroblast gene signature (D) (see Supplementary Table 1, available online, for details); and to NOX4 (E). F) Immunohistochemistry staining for NOX4 and α-SMA in serial sections of HNSCC, EAC, and COAD tissue samples (scale bar represents 50 µm). Please see Supplementary Figure 3 (available online) for more information. COAD = colon adenocarcinoma; ECM = extracellular matrix; EAC = esophageal adenocarcinoma; HNSCC = head and neck squamous cell carcinoma.

