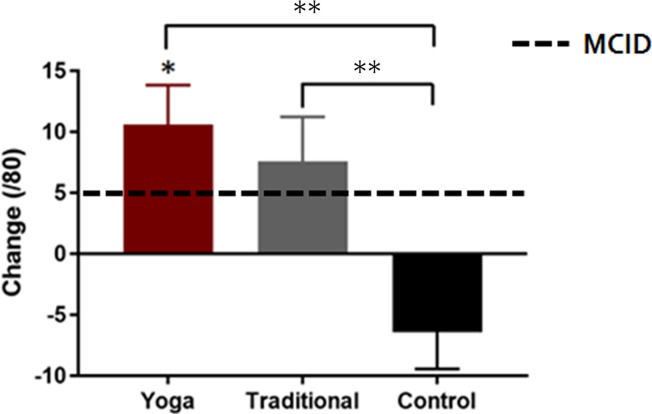
Fig 3. Self-reported physical function measured using the Lower Extremity Functional Scale.
Data are presented as mean ± standard error change (follow-up minus baseline values) in scores relative to the minimal clinically important difference (MCID) values. Significant between-group differences are denoted with ** and within-group change with *.

