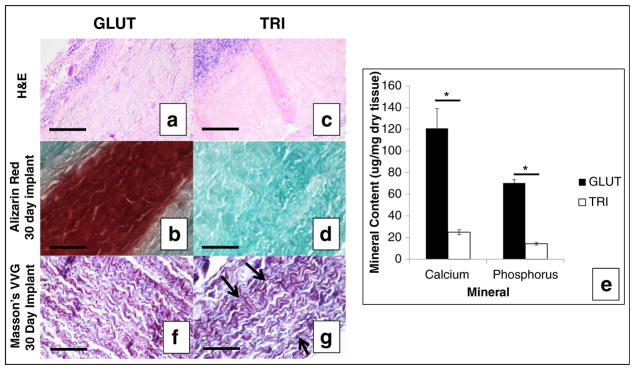
Fig. 8.
Histological assessment of GLUT or TRI BP after 30 days in vivo implantation. a, c H&E stain. b, d Alizarin red stain and counterstained with green for calcium. e, f Masson’s VVG stain, black arrows indicate dark black to purple fibers of elastin. Collagen is stained dark blue or purple; scale bars represent 200 μm. g Quantitative mineral content in explanted BP patches. Asterisk indicates significant difference (p < 0.05)

