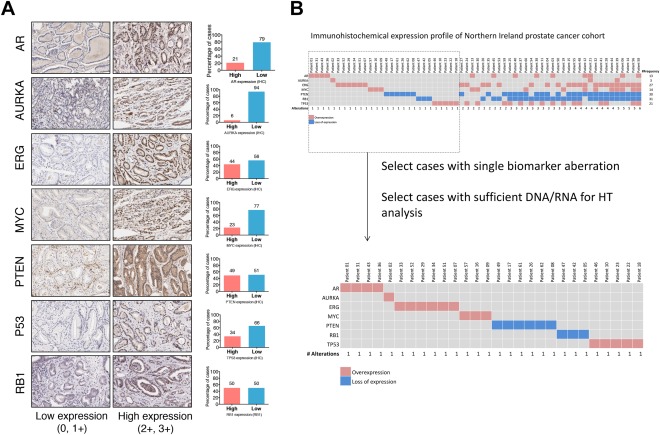
Figure 2.

(A) Representative immunohistochemical expression of the markers utilized in the selection of cases for high‐throughput analysis. Bar charts adjacent to each marker describe the dichotomized expression frequencies (0, 1+ versus 2+, 3+) of the corresponding marker. (B) Diagram describing the sample selection criteria for high‐throughput analysis. The patients (N = 62) were aligned according to the number of genomic aberrations present, in ascending order. A total of 28 cases were chosen on the basis that they each represent a single biomarker aberration based on their immunohistochemical expression. HT, high throughput.
