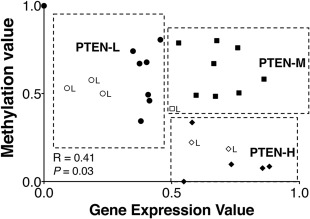
Figure 3.

Integrated analysis of untreated Gleason 7 (3 + 4) prostate tumours revealed distinct subgroups associated with PTEN status. Bivariate correlation analysis of whole genome gene expression and methylation data showed the stratification of three subgroups of cases associated with their PTEN status; PTEN‐H (high PTEN gene expression and low methylation); PTEN‐M (high PTEN gene expression and methylation; PTEN‐L (low PTEN gene expression and high methylation). A positive correlation between gene expression and methylation status was observed (R = 0.41, p = 0.03). Cases with low PTEN immunohistochemistry expression status are denoted with ‘L’ next to each sample case in the correlation plot.
