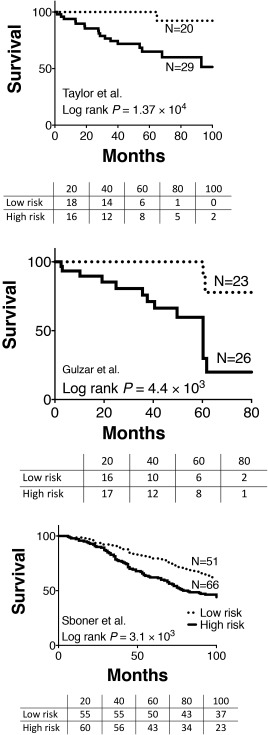
Figure 5.

The prognostic value of the 35‐gene expression signature was analysed in three independently published datasets, GSE21032, GSE16560 and GSE40272 [20–22]. The survival plots depicted here were derived from Kaplan–Meier analysis (the P values summarize the differences by the log‐rank tests).
