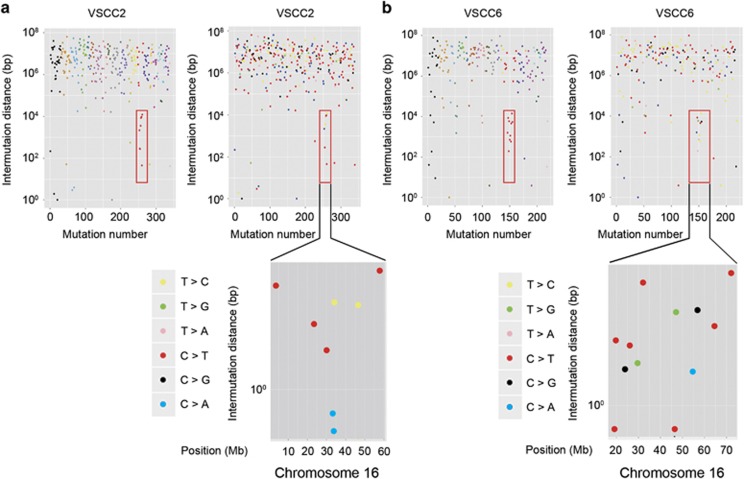
Figure 6.
Kataegis identified in vulvar cancers. Regional hypermutation plots in two cancers. Upper panels of a and b: the left plot represents an individual sample in which each dot represents a single somatic mutation colored on a chromosomal basis. The right plot represents the same data colored by mutation type. Mutations are ordered consecutively on the x axis from the first mutation in the short arm of chromosome 1 to the last mutation in the long arm of chromosome X. Kataegis at chromosome 16 is highlighted by a red square box. Lower panels of a and b: kataegis loci are shown on chromosome 16.

