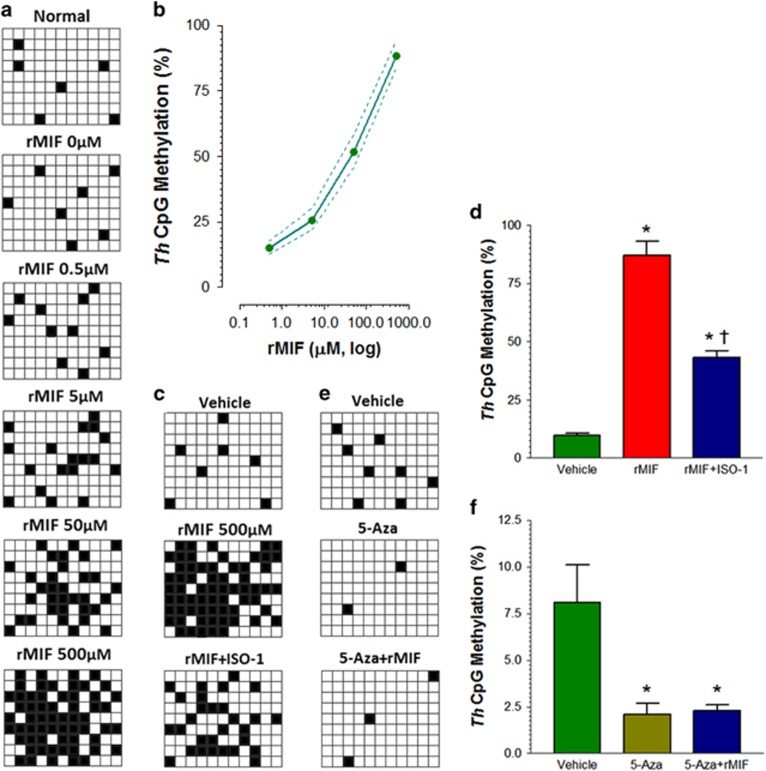
Figure 7.
Relationship of migration inhibitory factor (MIF) and Th CpG island methylation in cultured dopaminergic neurons. Ascending doses of rMIF (0, 0.5, 5, 50 and 500 μM) were applied to cultured dopaminergic neurons for 30 min at 37 °C, Th promoter CpG island methylation level was detected with BiSS (a, b). When ISO-1 was co-incubated, Th promoter CpG island methylation level in vehicle, rMIF, and rMIF+ISO-1 dopaminergic neurons was observed with BiSS as well (c, d), *P<0.05 vs vehicle; †P<0.05 vs rMIF). In addition, the Th methylation level was also evaluated in vehicle, 5-Aza and 5-Aza+rMIF incubation dopaminergic neurons (e, f), *P<0.05 vs vehicle). Each grid row represents one Th promoter CpG island, and each column denotes one clone number in a, c and e. White and black grid indicates unmethylated and methylated cytosine, respectively. Data are shown as the means±s.e.m.’s and were analyzed with one-way ANOVA. N=9 (clone number in a, c and e).

