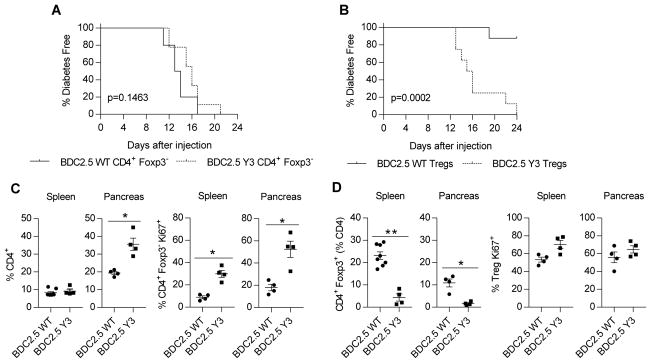
Fig. 5. Functional activity of Teff and Treg cells that express IL-2RβY3 on the NOD BDC2.5 background.
(A) Analysis of the onset of diabetes induced by CD4+ Teff cells. CD4+ Foxp3− T cells (5 × 10⁴) from NOD BDC2.5 or NOD-Y3 BDC2.5 mice were transferred into NOD.SCID recipients, which were monitored for 24 days. (B) Analysis of the suppression of diabetes by Tregs. Purified wild-type or IL-2RβY3 BDC2.5 Tregs (2.5 × 10⁴) were co-transferred with wild-type CD4+ Foxp3− BDC2.5 T cells (5 × 10⁴) into NOD.SCID mice, which were monitored for 24 days. Data in (A) and (B) were analyzed by log-rank test (n=9–10). (C and D) Analysis of the properties of Teff cells (C) and Tregs (D) from the mice shown in (B), where BDC2.5-WT or BDC2.5-Y3 on the x-axis refer to the type of Tregs transferred into the NOD.SCID recipients. Mice were analyzed when the mice were determined to be diabetic or 24 days after transfer. Data were analyzed by Mann-Whitney test (n=4–8).

