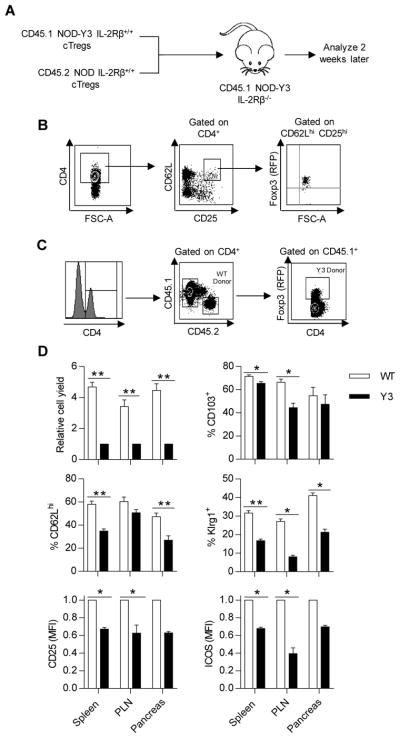
Fig. 7. IL-2RβY3 cTregs show impaired development into activated eTreg subsets.
(A) Experimental scheme showing how purified Tregs (8–15 × 104) from NOD and NOD-Y3 mice were premixed at a 1:1 ratio and verified by flow cytometry analysis before being transferred to NOD-Y3 IL-2Rβ−/− recipients. (B) Representative sorting strategy to purify donor-derived cTregs. (C) Representative flow plots to identify donor populations in male NOD-Y3 IL-2Rβ−/− hosts 2 weeks after transfer. (D) Relative donor Treg yields from the indicated tissues (n=5–6) and their expression of CD62L (n=5–6), CD25 (n=5–6), CD103 (n=3–4), Klrg1 (n=4–6), and ICOS (n=5–6) from the indicated tissues. Data were analyzed by Wilcoxon signed-rank test for MFIs, whereas the Mann-Whitney test was used for the remaining samples.

