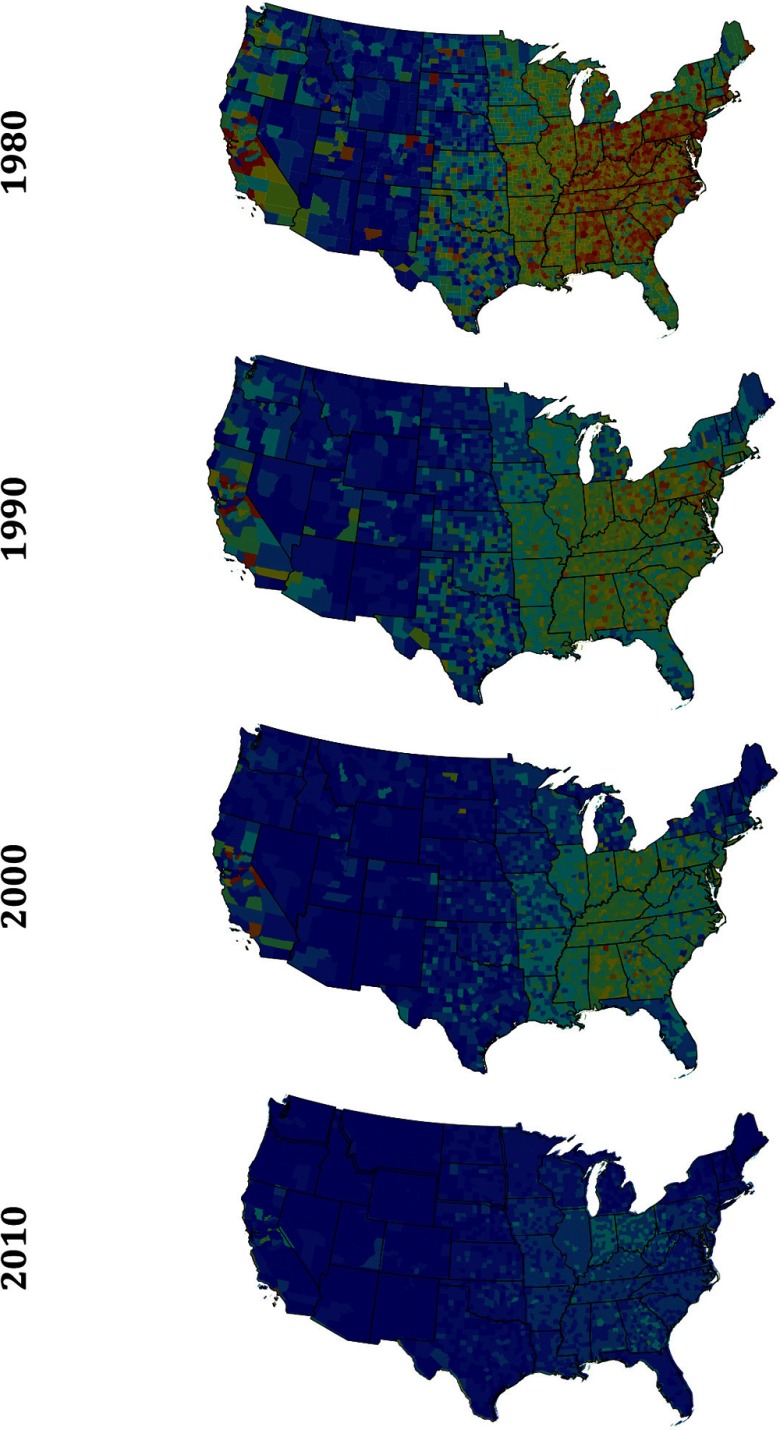
Figure 1.
The fraction of total all-cause deaths attributable to in U.S. counties in the years 1980, 1990, 2000, and 2010 among adults ages 30 and older (calculated using risk coefficient from Krewski et al. 2009). State and county boundaries for each year drawn according to Census Topologically Integrated Geographic Encoding and Referencing (TIGER)/Line files as reported by the Minnesota Population Center National Historical Geographic Information System (NHGIS Database).

