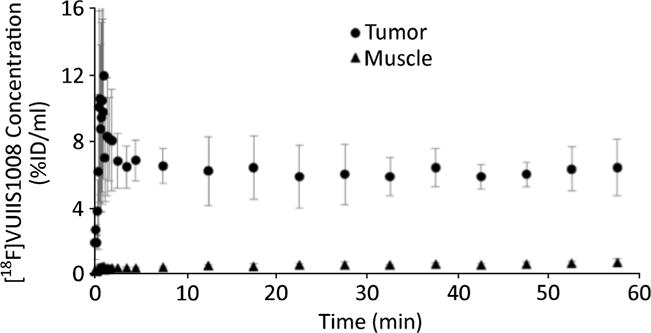
Fig. 3.

Average time-activity curves of [18F]VUIIS1008 in tumor and muscle regions of interest. The error bars illustrate the standard deviation at each time point across animals (n = 9). Tumor uptake was markedly highly than that found in muscle and essentially constant between 5 and 60 min after administration.
