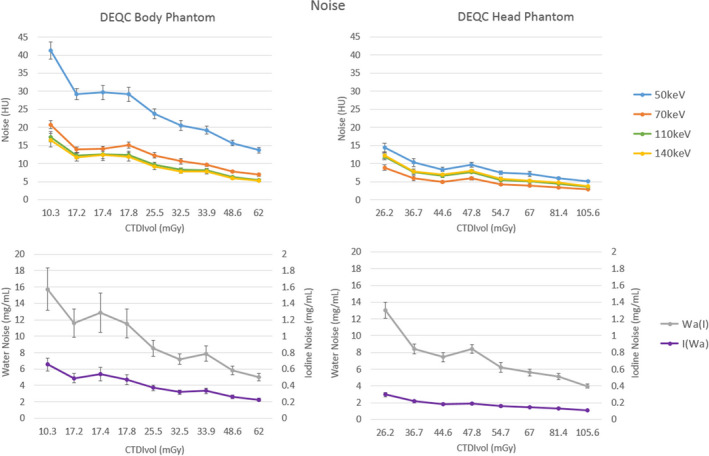
Figure 5.

Noise plotted by the technique parameter isolated as major variance contributors in Table 9: CTDIvol for the DEQC body phantom for both monoenergetic (upper left) and material density reconstructions (lower left). Noise was measured as the standard deviation within the brain material insert (see Fig. 1 for brain insert positioning). Error bars represent standard deviation across 10 scanners and 13 weeks.
