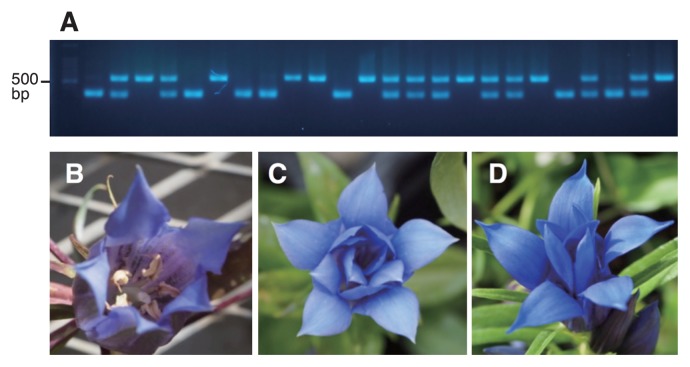
Fig. 2.
Molecular DNA marker analysis of an F2 population for the selection of double- flowered gentian individuals. (A) Twenty-four F2 individuals derived from selfing of an F1 (single-flower × double-flower) population were subjected to multiplex PCR analysis. Left lane, 100-bp ladder marker with the 500-bp band indicated. Fragments of ca. 530 bp indicate the AG1 mutated allele while those of ca. 350 bp indicate the normal allele. An example of a typical single-flower (B) and two examples of double-flowers (C, D).

