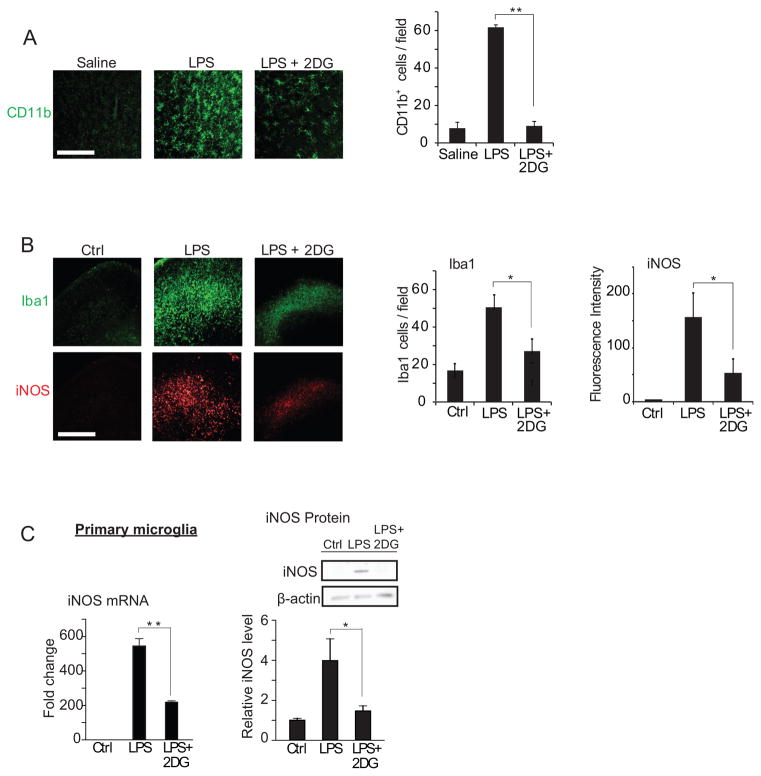
Figure 4. Glucose metabolism affects microglial activation and ROS production at the transcriptional level.
(A) Immunostaining for CD11b identifies activated microglia in rat hippocampus. CD11b expression was increased 24 hours after intraperitoneal injection with LPS (10 mg/kg). The increase was attenuated by co-injection with the glycolytic inhibitor 2-deoxyglucose (2DG; 100mg/kg). Scale bar = 100 μm. ** p < 0.01, n = 6. (B) Immunostaining for Iba1 and iNOS identify activated microglia in mouse hippocampal slice cultures after 24 hours incubation with LPS (10 μg/ml) or LPS +2DG (1 mM). Scale bar = 100 μm; n ≥ 3, * p < 0.05. Culture medium for contained 6 mM glutamine and 5 mM glucose. (C) Effects of 1mM 2DG on LPS - induced iNOS transcript and protein expression in microglial cultures. n = 5; * p < 0.05, ** p < 0.01. Data are means ± s.e.m. Figure adapted from (Shen et al. 2017).

