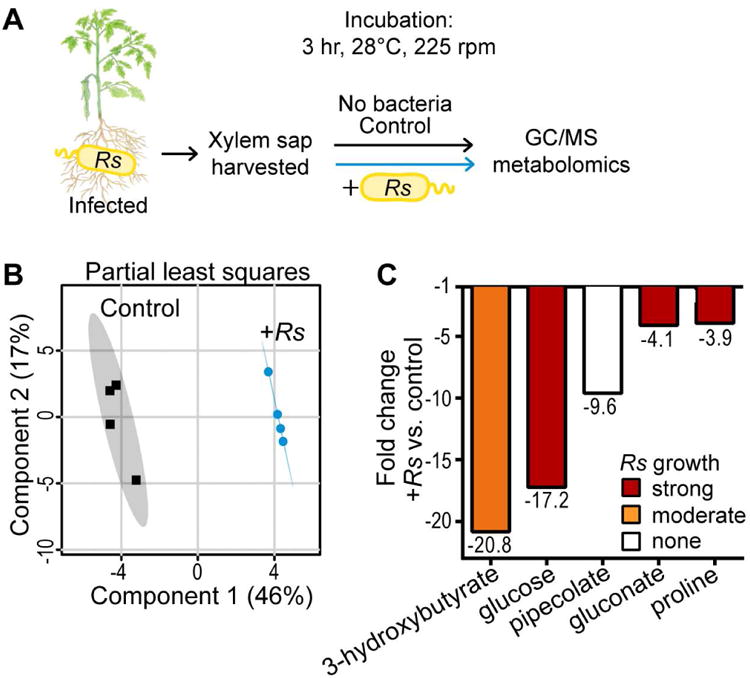
Figure 2. Xylem sap metabolites consumed during R. solanacearum GMI1000 growth.

(A) Sap was harvested from infected tomato plants at wilt onset. Pooled sap was incubated with R. solanacearum or water for 3 h before GC-MS metabolomic analysis (n=4 pools of 7 plants each). (B) Partial least squares analysis of sap composition metabolomic data. Shaded areas indicate 95% confidence region. (C) Xylem metabolites altered by R. solanacearum growth, fold-change relative to sap incubated without R. solanacearum (t-test, FDR<0.1) Bar color shows R. solanacearum growth on each metabolite as sole carbon or nitrogen (“N”) source.
