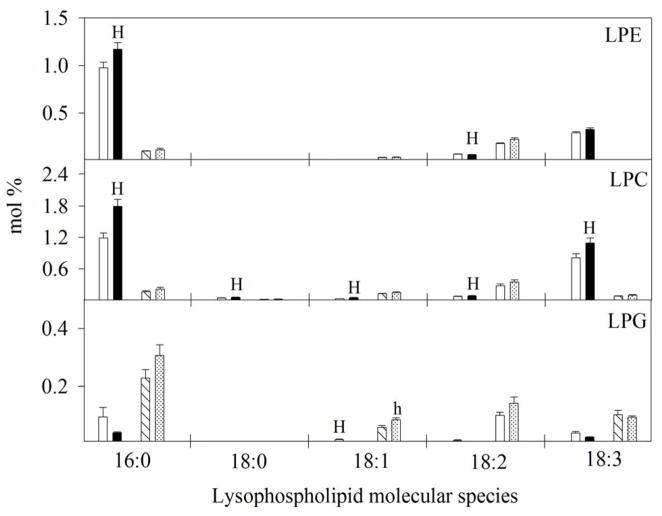
Figure 13.
Impact of temperature regimes (OT: 30/20 or HT1: 36/26 or HT2: 39/29 °C daytime maximum/nighttime minimum temperature) on lysophospholipid molecular species (mol %) in pollen and pistil. Each data point is the average of five independent observations. Vertical bars denote ± s.e. of means. Means followed by the same letter(s) were not significantly different (P≤0.05) as determined by LSD test. The letters ‘H’ and ‘L’ and indicate whether the amount of lipid was significantly higher or lower (P≤0.05), respectively, in HT, than AT in pollen. Similarly, the letters ‘h’ and ‘l’ indicate whether the amount of lipid was significantly higher or lower (P≤0.05), respectively, in HT, than AT in the pistil. LPC: lysophosphatidylcholine, LPE: lysophosphatidylethanolamine, AT: ambient temperature (outside the heat tent) and HT: high temperature (inside the heat tent).

