
Figure 3. RMS of responses to stimulus onset and differentiated inter-trial phase coherence (dITPC).
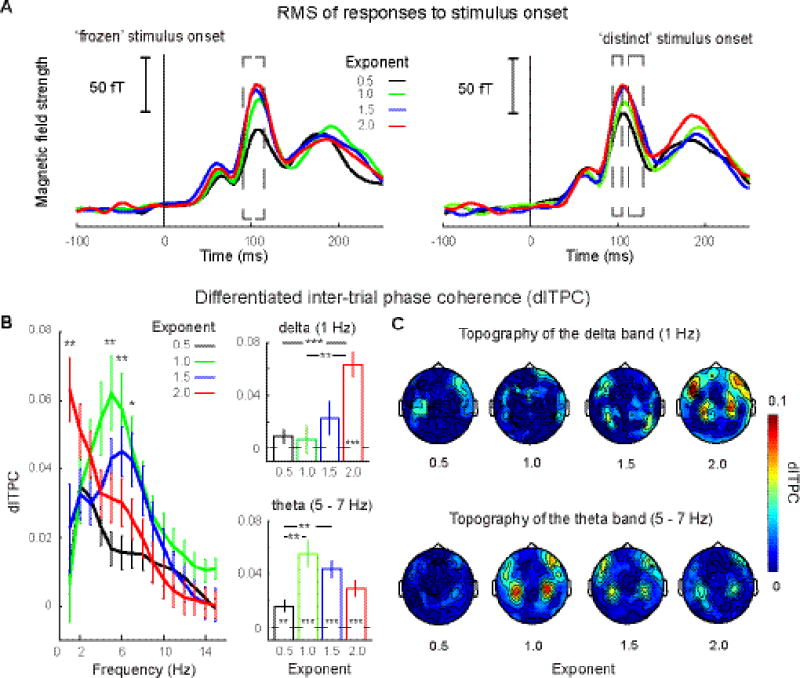
A, RMS of response to the ‘frozen’ and ‘distinct’ stimuli. Left panel: RMS of responses to the ‘frozen’ stimuli. Right panel: RMS of responses to the ‘distinct’ stimuli (color code as in Figure 1). The dashed box of the left panel indicates the time range from 90 ms to 115 ms that shows significant effects of the Exponent for the ‘frozen’ stimuli (p < 0.05, one-way rmANOVA). The dashed boxes of the right panel indicate the time ranges from 95 ms to 105 ms and from 115 ms to 130 ms that show significant effects of the Exponent for the ‘distinct’ stimuli. B, dITPC on auditory channels. Left panel: dITPC from 1 Hz to 15 Hz (color code as in Figure 1.) We found significant main effects of Exponent in two frequency bands: delta (1 Hz) and theta (5 – 7 Hz). Right panels: averaged dITPC within frequency bands. Asterisks inside bars indicate that dITPC is significantly above zero. The theta band activity tracks all stimuli, even if there is no regular temporal structure present; delta band activity is more narrowly responsive to stimuli with exponent 2. C, Topographies of dITPC in the delta and theta bands. Typical auditory response topographies can be seen in both bands. This underscores that the robust phase coherence results originate from auditory processing regions. Error bars represent +/− SEM.