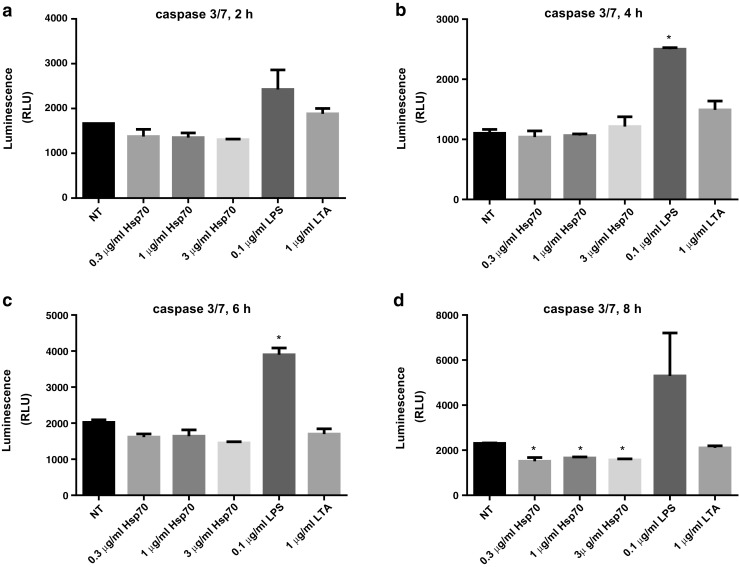
Fig. 10.

Apoptotic effects of rhHsp70, LPS, and LTA on THP-1 cells after 2 (a), 4 (b), 6 (c), and 8 (d) h of treatment, as assessed by the caspase 3/7 activity. Data are represented as mean ± SEM and tested by ANOVA followed by multiple comparison by Sidak method. P < 0.05 is considered statistically significant. b *P = 0.0036 vs. non-treated. c *P = 0.0052 vs. non-treated. d *P = 0.0103, P = 0.0221, P = 0.0140 for 0.3, 1, and 3 μg/ml rhHsp70, respectively vs. non-treated cells
