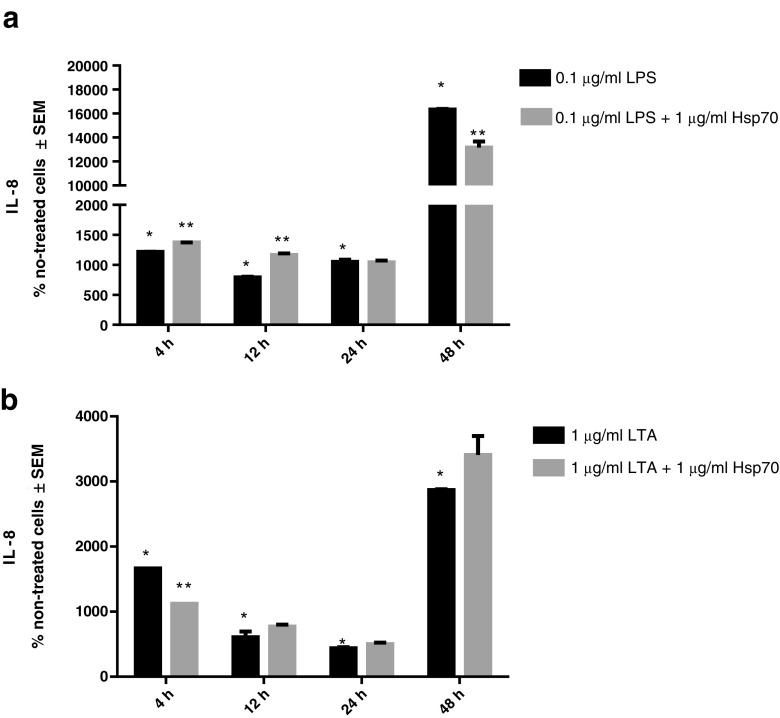
Fig. 5.
Production of IL-8 after 4, 12, 24, and 48 h treatment with LPS (a) and LTA (b) alone and in combination with rhHsp70. Data are presented as mean ± SEM and tested by unpaired t test. a *P < 0.0001 after 4 h, P = 0.0047 after 12 h, P = 0.0020 after 24 h, and P < 0.0001 after 48 h of treatment with LPS alone vs. non-treated cells. **P = 0.0004 after 4 h, P = 0.0051 after 12 h, and P = 0.0247 after 48 h of treatment with combination of rhHsp70 and LPS vs. LPS alone. b *P < 0.0001 after 4 h, P = 0.0113 after 12 h, P = 0.0315 after 24 h, and P < 0.0001 after 48 h of treatment with LTA alone vs. non-treated cells. **P < 0.0001 after 4 h of treatment with combination of rhHsp70 and LTA vs. LTA alone

