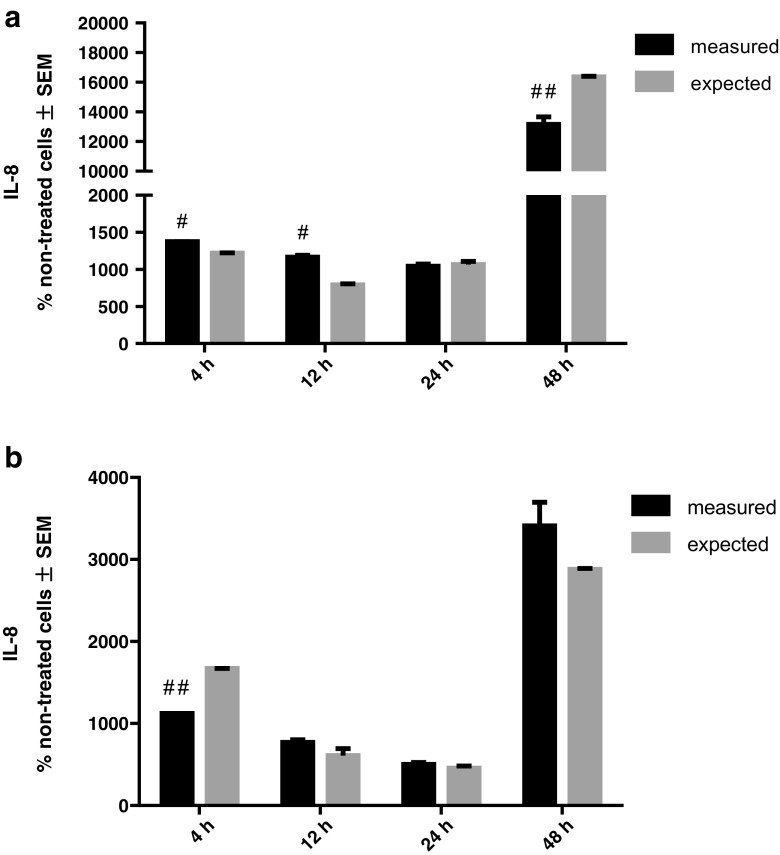
Fig. 6.
rhHsp70 and LPS (a) or LTA (b) interactions on IL-8 secretion. Dark bars represent the measured values and gray bars the expected values. Data are expressed as mean ± SEM. Tested using unpaired t test. A number sign indicates statistically significant synergistic effect; P = 0.0006 after 4 h and P = 0.0054 after 12 h for combination of LPS and rhHsp70. Double number signs indicate statistically significant antagonistic effect; P = 0.0254 after 48 h for combination of LPS and rhHsp70; P < 0.0001 after 4 h for combination of LTA and rhHsp70

