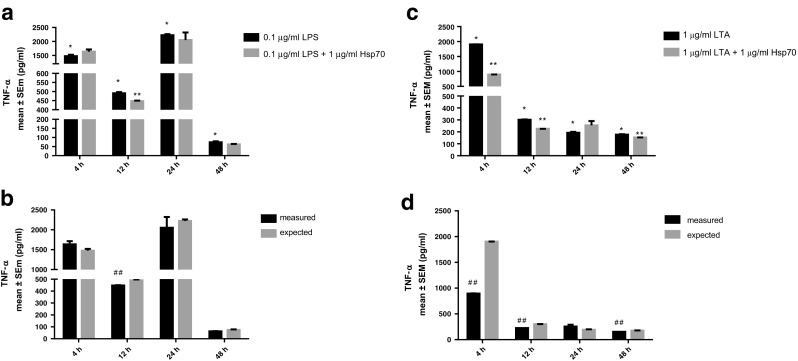
Fig. 8.

Effect of rhHsp70 and LPS or LTA combination on production of TNF-α after 4, 12, 24, and 48 h treatment. Upper panel: production of TNF-α after 4, 12, 24, and 48 h treatment with LPS (a) or LTA (c) alone and in combination with rhHsp70. Data are presented as mean ± SEM and tested by unpaired t test. a *P < 0.0001 after 4, 12, and 24 h, P = 0.0020 after 48 h of treatment with LPS vs. non-treated cells. **P = 0.0292 after 12 h for combination of rhHsp70 and LPS vs. LPS alone. c *P < 0.0001 after 4 and 12 h, P = 0.0179 after 24 h, and P = 0.0001 after 48 h of treatment with LTA vs. non-treated cells. **P < 0.0001 after 4 h, P = 0.0012 after 12 h, and P = 0.0283 after 48 h for combination of rhHsp70 and LTA vs. LTA alone. Lower panel: rhHsp70 and LPS (b) or LTA (d) interactions on TNF-α secretion. Dark bars represent the measured values and gray bars the expected values. Data are expressed as mean ± SEM. Tested using unpaired t test. Double number signs indicate statistically significant antagonistic effect P = 0.0292 after 12 h for combination of rhHsp70 and LPS; P < 0.0001 after 4 h, P = 0.0012 after 12 h, and P = 0.0283 after 48 h for combination of rhHsp70 and LTA
