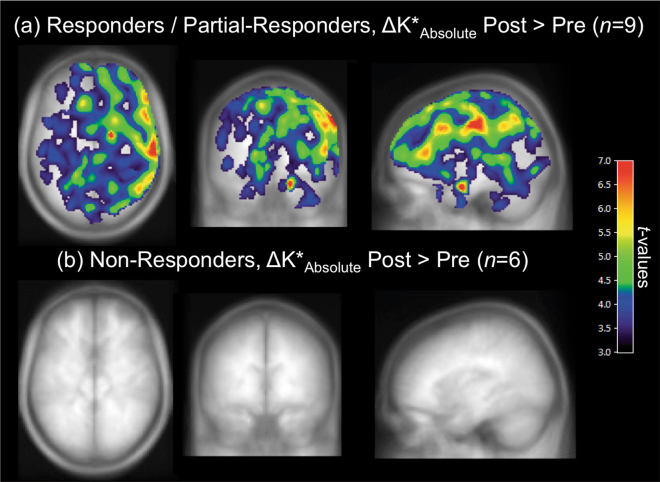
Fig. 2. Pre–post treatment increases in serotonin synthesis capacity in responders/partial responders and non-responders.
Maximum intensity projections of the t-values, showing brain regions where absolute K* values (K*Absolute) were higher post-treatment compared to pre-treatment in clinical response sub-groups. a Responders and partial responders to either CBT or SSRI treatment (n = 9) demonstrated widespread pre–post treatment increases in absolute regional K* values. b Non-responders (n = 6) did not show any significant pre–post changes in absolute regional K* values. For visualization purposes, the displayed t-map threshold was T8 = 3.4 for responders/partial responders and T5 = 4.0 for non-responders, with p = 0.005 and an extent threshold of 50 voxels

