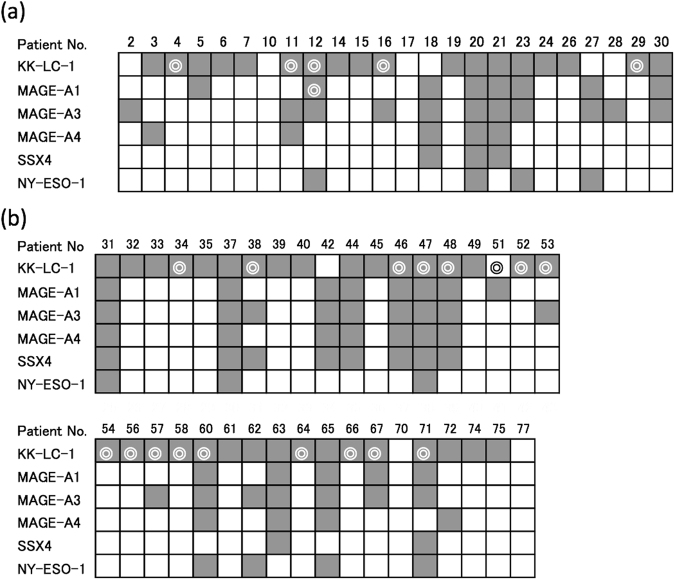
Figure 1.
Expression of CTAs in tumour and normal areas of each gastric cancer patient. Each gastric specimen carrying a tumour was sampled in one tumour area and one (a) or two (b) non-tumour areas that were distant from the tumour and random. Each specimen was evaluated for the expression of CTAs in a tumour area and non-tumour area(s). Open or closed squares indicate no expression or expression of the CTA in a tumour area. Double circles represent expression of the CTA in a non-tumour area (a) or one or both non-tumour areas (b).

